What is the Elevation Layer?
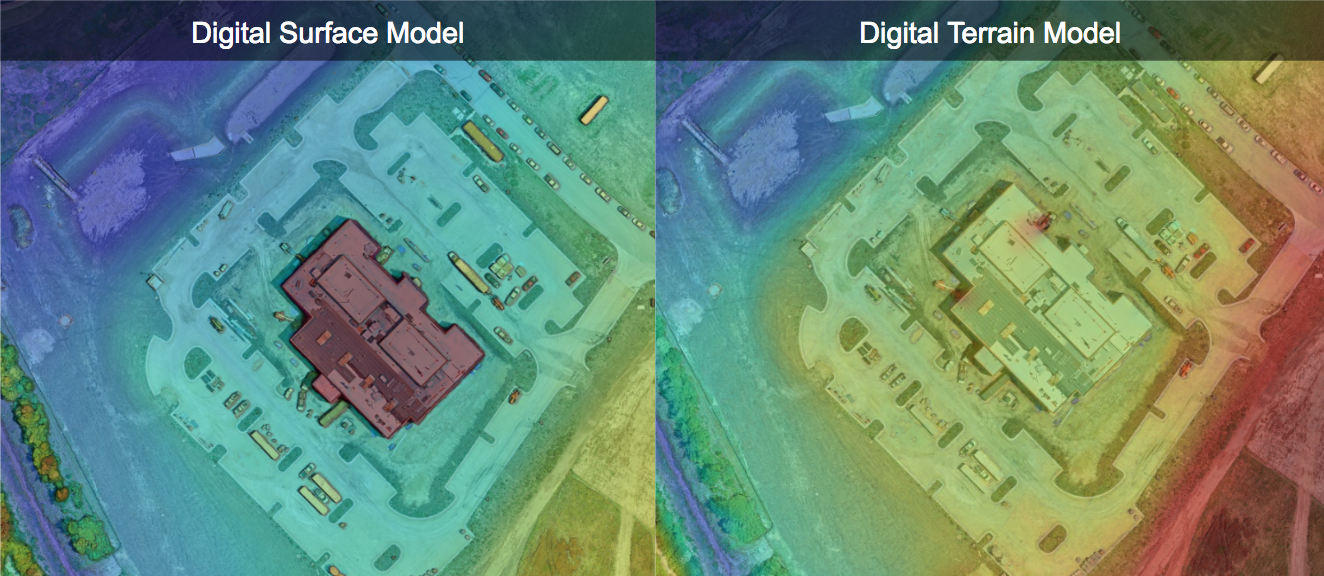
The Elevation Layer allows you to view the elevation of your map using either a Digital Surface Model (DSM) or a Digital Terrain Model (DTM). The DSM is the default view and displays the heights of all objects on the map, including buildings and trees. The DTM filters out these objects to show the underlying terrain.
Availability: Who has access?
Elevation Toolbox: Available to all Individual, Advanced, and Enterprise customers.
Getting the Elevation Layer
Elevation data is generated automatically from the geospatial information embedded in your images during processing.
Global Reference System: By default, elevation information is expressed in the WGS 84 Global Reference system.
Spatial Reference Systems: You can calibrate elevation to view data relative to a different ellipsoid model or export data in various coordinate systems.
Using the Elevation Layer
To get started, navigate to the Map Analysis section and select the Elevation layer from the side panel.
Open your map from the dashboard.
Select the Elevation layer from the options under the Map tab.
Note: This updates the top-left panel to show a histogram of the elevation data.
Expand the Elevation Toolbox by clicking the Arrow next to the Elevation layer.
Intensity and Opacity
Adjust the visual depth and transparency of the layer:
Intensity: Select shadow intensities from Low to Max to emphasize terrain depth.
Opacity: Use the slider to adjust the visibility of the elevation data over the orthomosaic.
Range of values
The elevation histogram allows you to isolate specific data points:
Adjusting Range: Use the sliding handles at the bottom of the histogram to change the values presented on the map. The map updates automatically.
Map Area: The number at the top of the histogram represents the total area of the map that falls within your specified range.
Elevation Profile
Use the Distance tool within the Annotation and Measurement toolbox to display a cross-section or elevation profile. This is useful for:
Measuring the height of specific features.
Calculating the slope of a line segment (height change / distance).
Determining if an area is flat, bumpy, or sloped.
Viewing elevation at a specific cursor point from the Surface Profile graph
Steps to display the elevation profile:
Create a line using the Distance tool.
Click on the line until the cross-arrows appear.
View the elevation profile, including vertical height and cross-section, in the left map panel.
Elevation at cursor point
To see the elevation of a specific point, hover your cursor over any area of the Surface Profile graph. The elevation location appears as a dot in the annotation.
Exporting the elevation map
After setting your desired limits in the histogram, you can export the data:
Navigate to the Explore Tab and select Export.
Select the Elevation layer.
Choose your file format. Options include Contours and Raw Elevation Values (DEM).
Note: DEM exports are based on the elevation profile set in DroneDeploy.
Exporting DTM
Click the Export button at the bottom of the Explore page. If the DTM layer is toggled on, it is selected by default.
Supported Formats: JPG, PDF, GeoTIFF, Raw values, DXF, and SHP.
Digital Terrain Model (DTM)
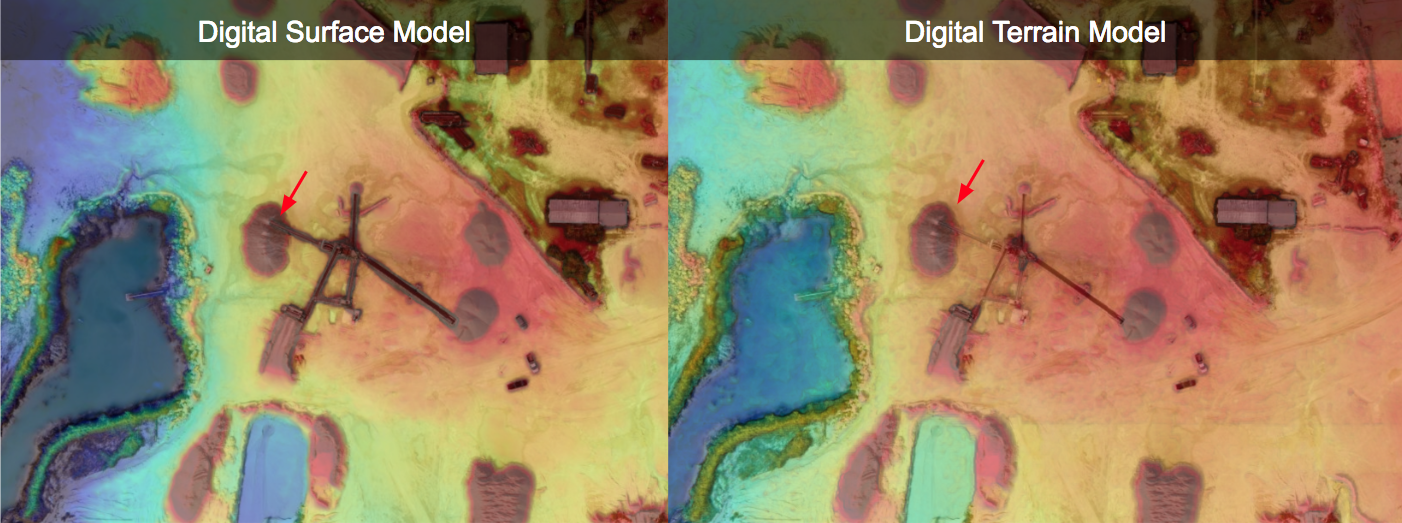
While a DSM includes all surfaces (trees, equipment, structures), the DTM uses machine learning and image segmentation to filter out non-terrain artifacts. This is essential for designing projects, estimating earthmoving, or measuring material volumes.
Viewing the DTM layer
Turn on the Elevation layer.
Toggle on Terrain only.
(Optional) Change the layer opacity by drilling down to the Elevation page.
Using DTMs for volume measurements
In most cases, use the DSM for volume measurements. However, use the DTM when you need to exclude equipment (like conveyors) from the measurement:
Mining Customers: DroneDeploy uses a specialized DTM algorithm designed to preserve stockpiles while removing conveyors. Select Digital Terrain Model as the surface when measuring these volumes.
Limitations
Legacy Maps: Maps processed before April 18, 2019, use relative elevation (feet/meters above or below takeoff) rather than WGS 84 absolute elevation. Use the Elevation Calibration tool to align these with newer data.
Algorithm Variations: The DTM algorithm for mining is optimized for stockpiles, while the standard algorithm is optimized for removing trees and buildings.
FAQs
Q: What if I need my data in a different spatial reference system?
A: You can calibrate the elevation to a different ellipsoid model or export the data in a variety of coordinate systems.
v2.2