What is the point measurements layer?
The point measurements layer allows you to visualize discrete sensor measurements over a specific location area. While originally designed to visualize methane concentrations, this layer is sensor-agnostic. It can visualize any data set provided it includes the measured value, latitude, and longitude of the measurement location.
Once processed, the data appears as a heatmap, allowing for easy identification of high-concentration areas or specific data points.
Availability
Enterprise subscriptions only.
Please reach out to Support or your Customer Success Manager for more information.
How to use the point measurements layer
Follow these steps to import and visualize your sensor data.
1. Download the CSV template
To ensure your data is formatted correctly, we recommend using our pre-formatted template.
Navigate to the Explore tab.
In the Layers section, click Add.
Select Point Measurement (CSV).
Download the provided CSV template.
2. Format your data
The analysis layer requires specific columns to visualize the data correctly. Ensure your CSV file contains the following minimum columns:
Value: The sensor measurement.
Latitude: The latitude coordinate (WGS 84 Web Mercator).
Longitude: The longitude coordinate (WGS 84 Web Mercator).
Timestamp: (Optional) formatted as
YYYY/MM/DD HH:MM:SS.
3. Import and process
Return to the Layers section in the Explore tab.
Click Add and select your formatted CSV file.
Once processed, a heatmap will automatically populate in the Layers section using a default scale.
4. Customize and crop
You can adjust the visualization to better fit your reporting needs.
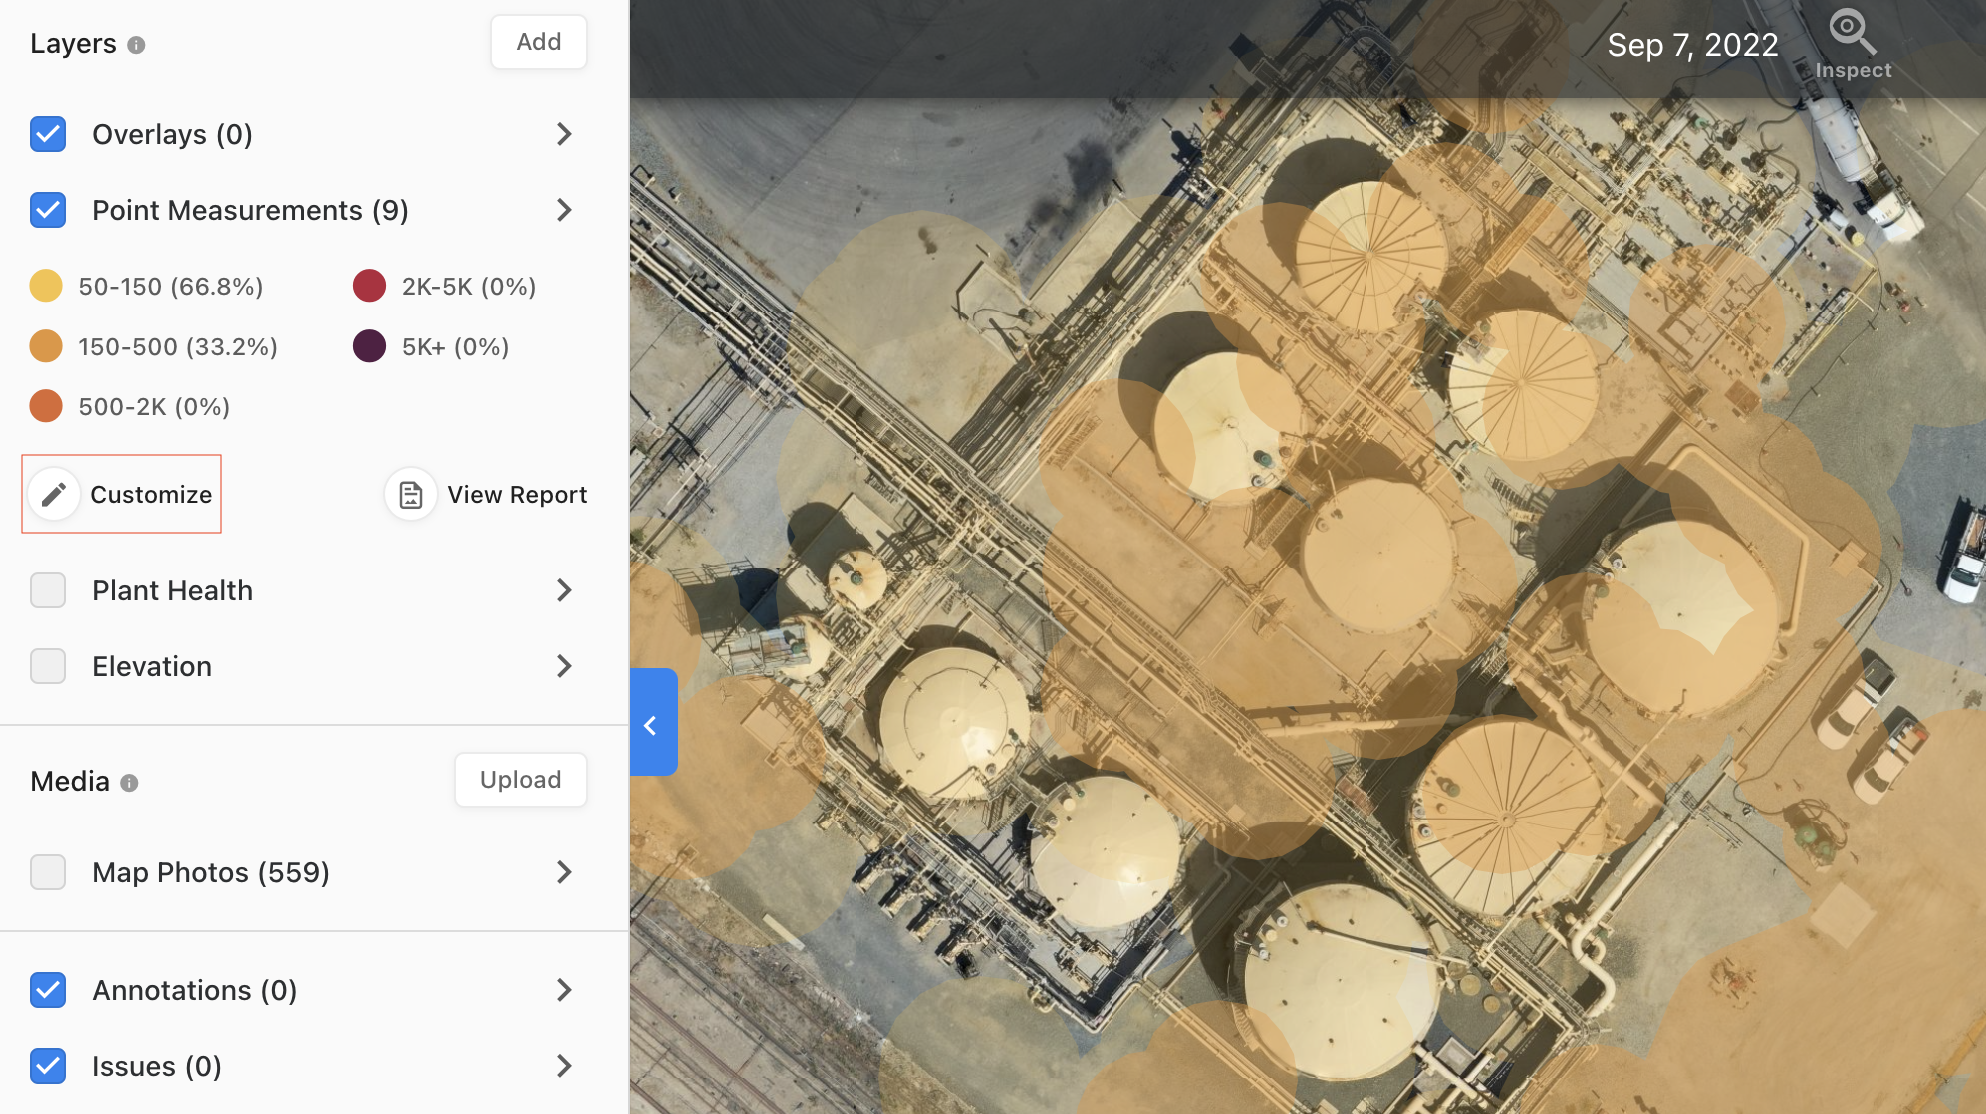
Adjust Scale: Click Customize to adjust the color schema and scale of the heatmap.
Rename Layer: Rename the layer to reflect the specific measurement name and units.
Crop: Use the crop functionality to limit the visual representation of the dataset to a desired area.
Key features
Sensor Agnostic: Visualize any discrete data point defined by value and location.
Heatmap Visualization: Automatically converts point data into an easy-to-read heatmap.
Flexible Reporting: Generate reports directly from the measurements tab or the reports page. You can add comments to reports to provide additional context.
Limitations
Source Precision: Increased concentrations in the heatmap are not always located exactly above the source of a leak (e.g., methane). Users should rely on additional data, such as wind speed and direction, to identify the precise source.
Coordinate System: All latitude and longitude data must be in WGS 84 Web Mercator.
Column Formatting: Data must follow the strict
Value; Latitude; Longitudecolumn structure.
FAQs
Q: Can I import multiple measurement files?
A: Yes, you can import as many measurement files as you need.
Q: What sensors does the visualization support?
A: The layer is sensor-agnostic. As long as the data is formatted into Value, Latitude, and Longitude columns, it can be visualized.
Q: Can I add comments to the report?
A: Yes. The Report page is flexible and allows you to add any additional information or context needed.
Q: What CRS should the latitude and longitude be in?
A: All visualizations must be in WGS 84 Web Mercator.
V2.2