The Map Processing Report provides insights into how DroneDeploy processed your map. This report highlights key information, identifies flight discrepancies, and suggests factors to adjust to create the highest quality map.
Navigate to the Map Details section of your project to access the processing report.

Map Processing Report availability
The Map Processing Report is available for maps processed after October 2019. Maps processed before this date do not include a report. To populate a new report for an older map, contact the Support team at support@dronedeploy.com to request a reprocessing.
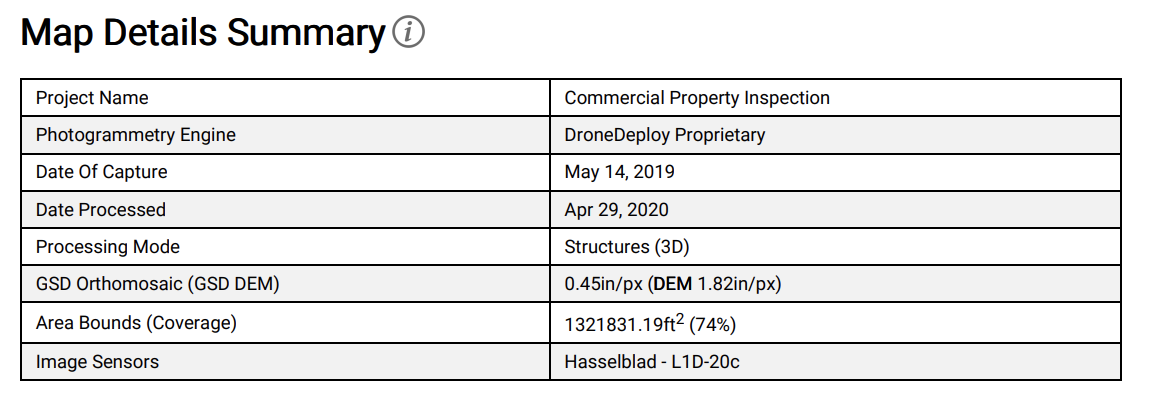
Map details summary
The map details summary provides an overview of key map details at the time of processing.
| Row Name | Definition |
|---|---|
| Project Name | Name given to the project during processing |
| Photogrammetry Engine | The engine used to process the map (DroneDeploy uses a proprietary algorithm) |
| Date of Capture | Date of flight derived from the drone metadata (EXIF) |
| Date Processed | Date the images were processed or reprocessed in DroneDeploy |
| GSD Orthomosaic | Ground Sample Distance. This represents the map resolution. DroneDeploy sets a minimum resolution threshold to calculate the GSD parameter. |
| Area Bounds (Coverage) | Area of the processed map and percent coverage of the selected region of interest (ROI) |
| Image Sensors | Camera used for the flight |
| Average GPS Trust | Average regional trust for GPS in meters |
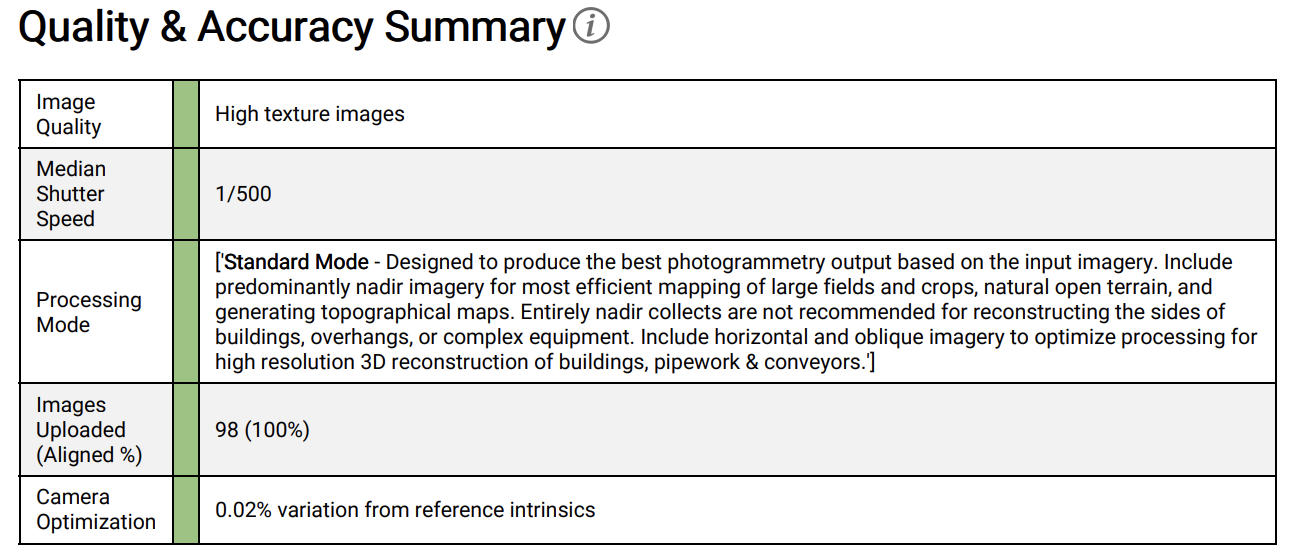
Quality and accuracy summary
The quality and accuracy summary identifies potential problem areas in the map processing. The report marks expected values in green and potential issues in orange.
| Row | Definition |
|---|---|
| Image Quality | Represents the image quality for stitching. High-texture images have crisp, detailed features. Low-texture images may appear blurry, over-exposed or smooth. |
| Median Shutter Speed | Shutter speed for the camera. Speeds slower than 1/80 may produce motion blur and result in incorrect scale or measurements. |
| Images Upload (Aligned %) | The number of images that provided the data required for processing. Unaligned images may lack metadata or sufficient overlap. |
| Camera Optimization | Principle Point: The initial values from the metadata may be adjusted during photogrammetry if they deviate from expected values. Contact the Support team if you notice high variation. |
| Focal Length: The focal length is estimated during processing. Variations of more than 5% from the reference value may indicate a problem with the lens. |
Simplified uploads
Uploads are now streamlined. You are not required to select a Map Type of Terrain or Structures when creating a new map. DroneDeploy applies optimal processing for both 2D and 3D to ensure high quality and fast processing speeds.
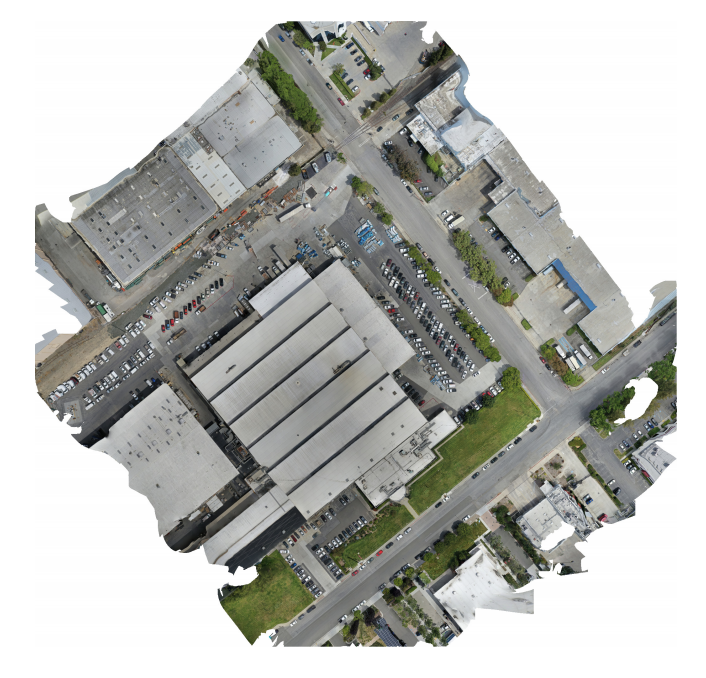
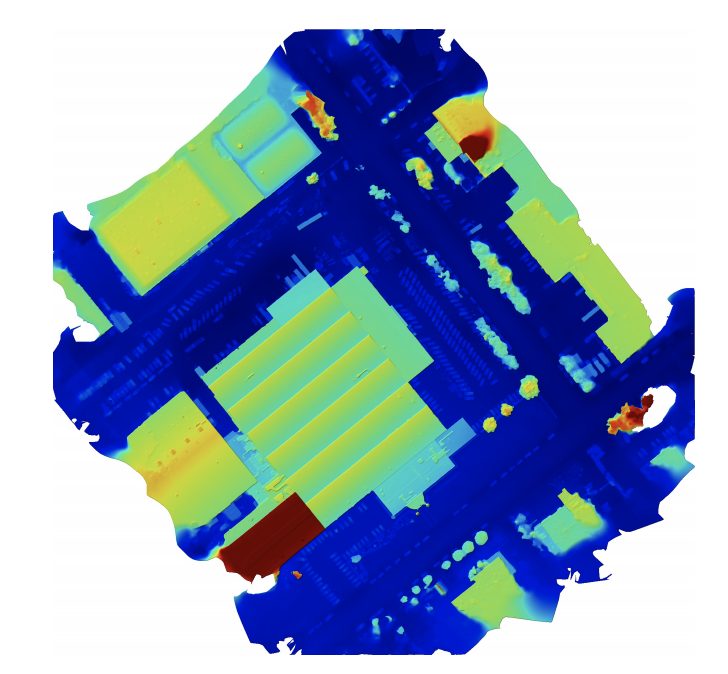
Preview
This section provides a preview of the processed orthomosaic and the elevation profile.
Dataset quality review
Input GPS Uncertainty: This plot represents the GPS input on the image. This plot appears only on RTK or PPK maps. It represents the reported error from the source image pre-processing. Large ellipses may indicate poor RTK or PPK connectivity during flight.
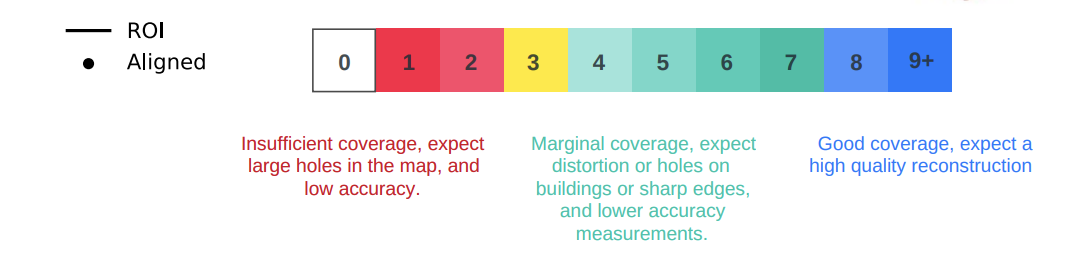
Orthomosaic coverage
This section shows the processing potential of the map. Black dots represent each image collected. Yellow squares represent GPS-aligned images. A yellow square indicates the image could not tie into the scene using the standard algorithm and used metadata to determine placement.
Photogrammetry matches key points across multiple photos to understand the relative position of cameras. Providing several high-quality images of every point via "overlap" is essential. DroneDeploy recommends an image density of 8-9 images per pixel (approximately 75/70 overlap).
Stay aware of your region of interest
Flying over buildings and trees can cause overlap issues. Set altitude and overlap based on the top of dense canopies for the best results. For more information, see our articles on Mapping tall buildings or trees and Terrain Awareness.
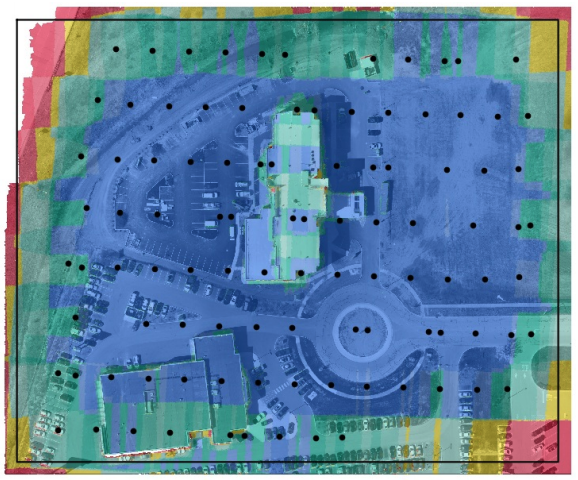
In areas with low density (red or yellow), increase the flight overlap or use enhanced 3D mode to improve the rooftop results. You can also crop the map to remove poor stitching from the edges.
Region of Interest (ROI): The specific area selected for processing
Aligned: Images successfully geolocated and aligned
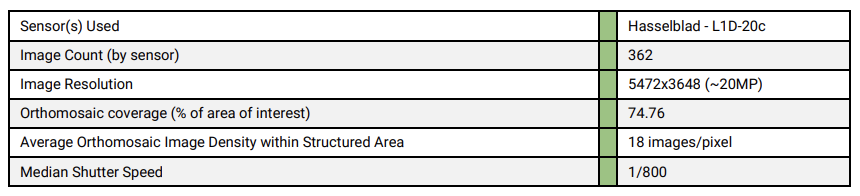
| Row | Definition |
|---|---|
| Sensor(s) Used | Camera and sensor used for the flight |
| Image Count (by sensor) | Images taken per sensor used during the mission |
| Image Resolution | Average resolution of all images in the uploaded set |
| Orthomosaic coverage | Average coverage of the ROI taking into account images per pixel |
| Average Orthomosaic Image Density | A measure of coverage within the structured area |
Pairs connectivity
If map processing fails before the Orthomosaic Coverage plot generates, the Pairs Connectivity plot appears instead. Each dot represents a collected image and lines connect pictures that are linked to one another.
The Solved Camera Locations plot may also appear to assist with diagnosis. It displays location and altitude information and indicates if each image is successfully structured.
Structure from motion 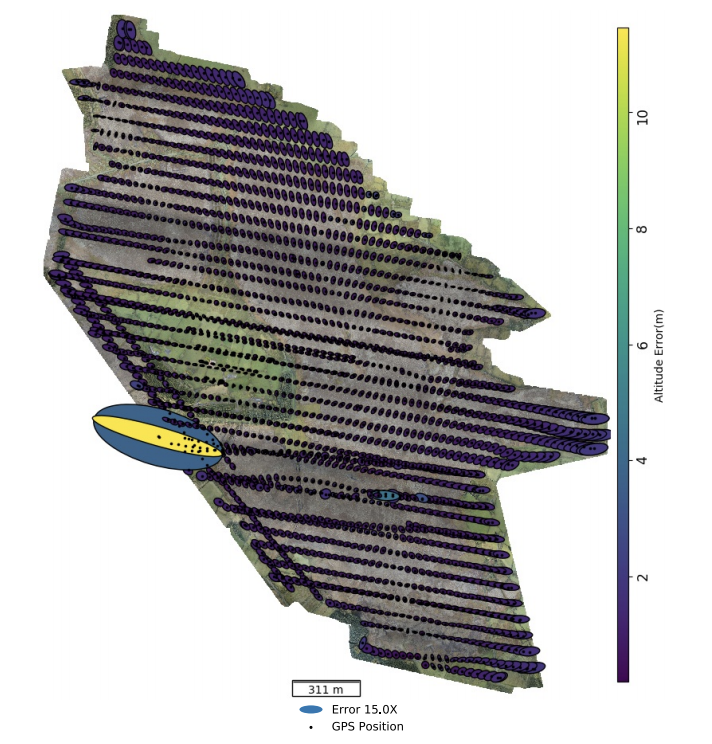
This diagram shows the GPS alignment versus the actual alignment of images. A smaller error indicates better results. This represents post-processing results. 
Aligned Cameras: DroneDeploy uses image content to place the camera in 3D space. 100% alignment means all uploaded images were used to reconstruct the map. Unaligned cameras (marked with a red X) were not used.
Root Mean Squared Error (RMSE): A measure of the spread of the error of the solved camera location versus the GPS value recorded in the images.
Note: Camera location error does not represent the true accuracy of a map. To measure true accuracy, include Checkpoints or objects with known dimensions.
Camera calibration
In an ideal calibration, the diagram is symmetrical and the crosshairs overlap.
A note about sensors
Using an unknown sensor may trigger a camera calibration warning. If the camera calibration is off by more than 5%, the system triggers a warning. 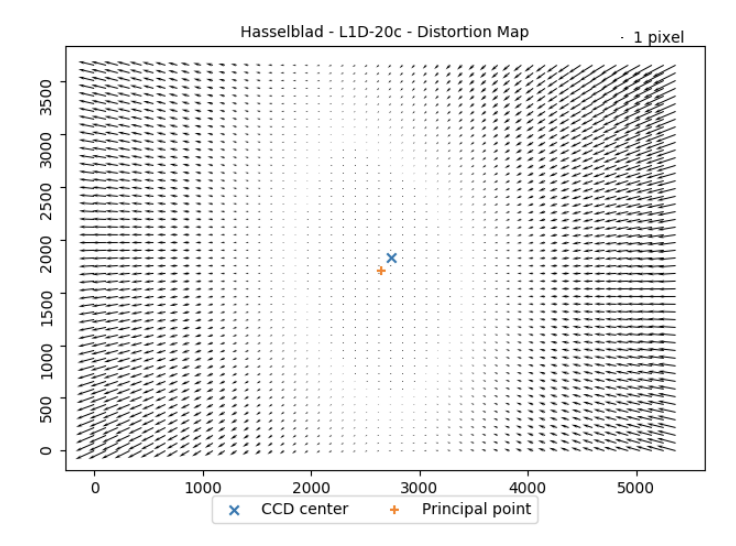
Densification and meshing
The densification and meshing table provides additional quality details. Expected values appear in green and potential issues appear in orange.

| Row | Definition |
|---|---|
| Processing Mode Quality | The quality selected for processing (Turbo or Quality) |
| Nadir Images | Percentage of straight-down imagery |
| Oblique Images | Percentage of angled imagery |
| Horizontal Images | Percentage of imagery showing the horizon or sky (these can cause reconstruction issues) |
| Total Points | The number of points in the point cloud |
| Point Cloud Density | Total points divided by the area of covered pixels |
| Mesh Triangles | The number of faces in the mesh |
Digital Elevation Model (DEM)
The Digital Elevation Model (DEM) section provides insight into how the elevation model was calculated. 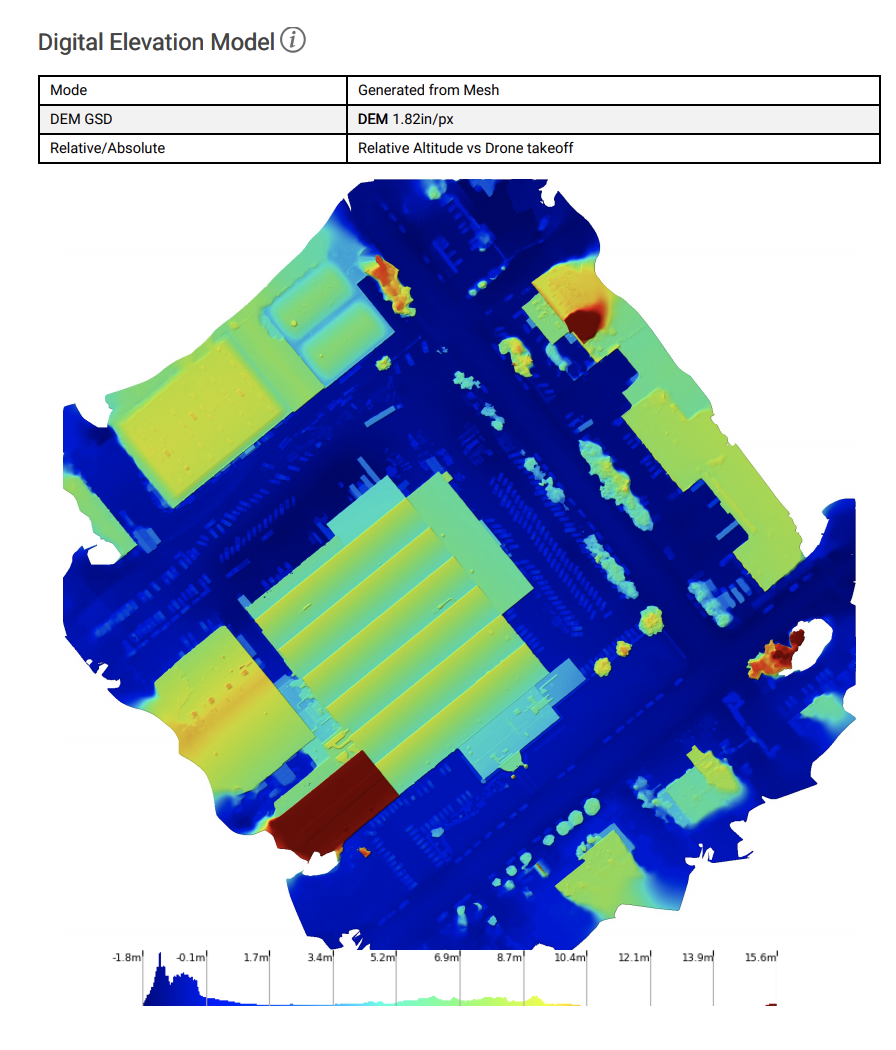
| Row | Definition |
|---|---|
| Mode | The mode used to process the map (typically "Generated from Mesh") |
| DEM GSD | The size of each pixel in the DEM |
| Relative/Absolute | Indicates if elevations are calculated based on absolute altitude |
GCPs and Checkpoints
If you include Ground Control Points (GCPs), they appear in the Map Processing Report. The report shades the controlled area and highlights measured errors for checkpoints. 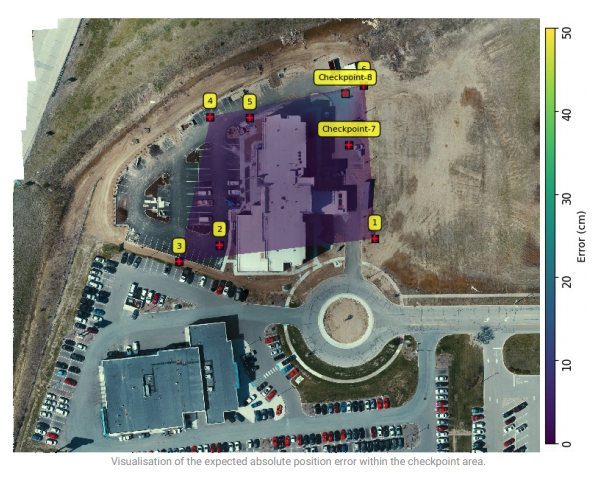
GCP alignment methods
Transform: Used for fewer than 3 GCPs. The map moves in XYZ only.
Similarity Transform: Used for high-trust GPS data (RTK or PPK) with GCPs. This conducts a 3D transformation to minimize distance to GCPs without warping the map.
Similarity Transform and Bundle Adjustment: Used for standard GPS data with GCPs. This adjusts camera parameters to align with the GCP datum.
Map alignment
DroneDeploy maps captured in the same location without GCPs align with previous days automatically. This section describes the required transformation. For more information, see Automatic Map Alignment. 
For more information, contact the Support team at support@dronedeploy.com.
v2.2