After you upload your imagery to DroneDeploy, our powerful processing software removes distortion and stitches individual photos together to create georeferenced mosaics. Once your map is completed you are able to view different layers of your map such as the Orthomosaic, Elevation layer, and Plant Health layer.
Viewing Multiple Data Layers with our New Layer Selection Interface
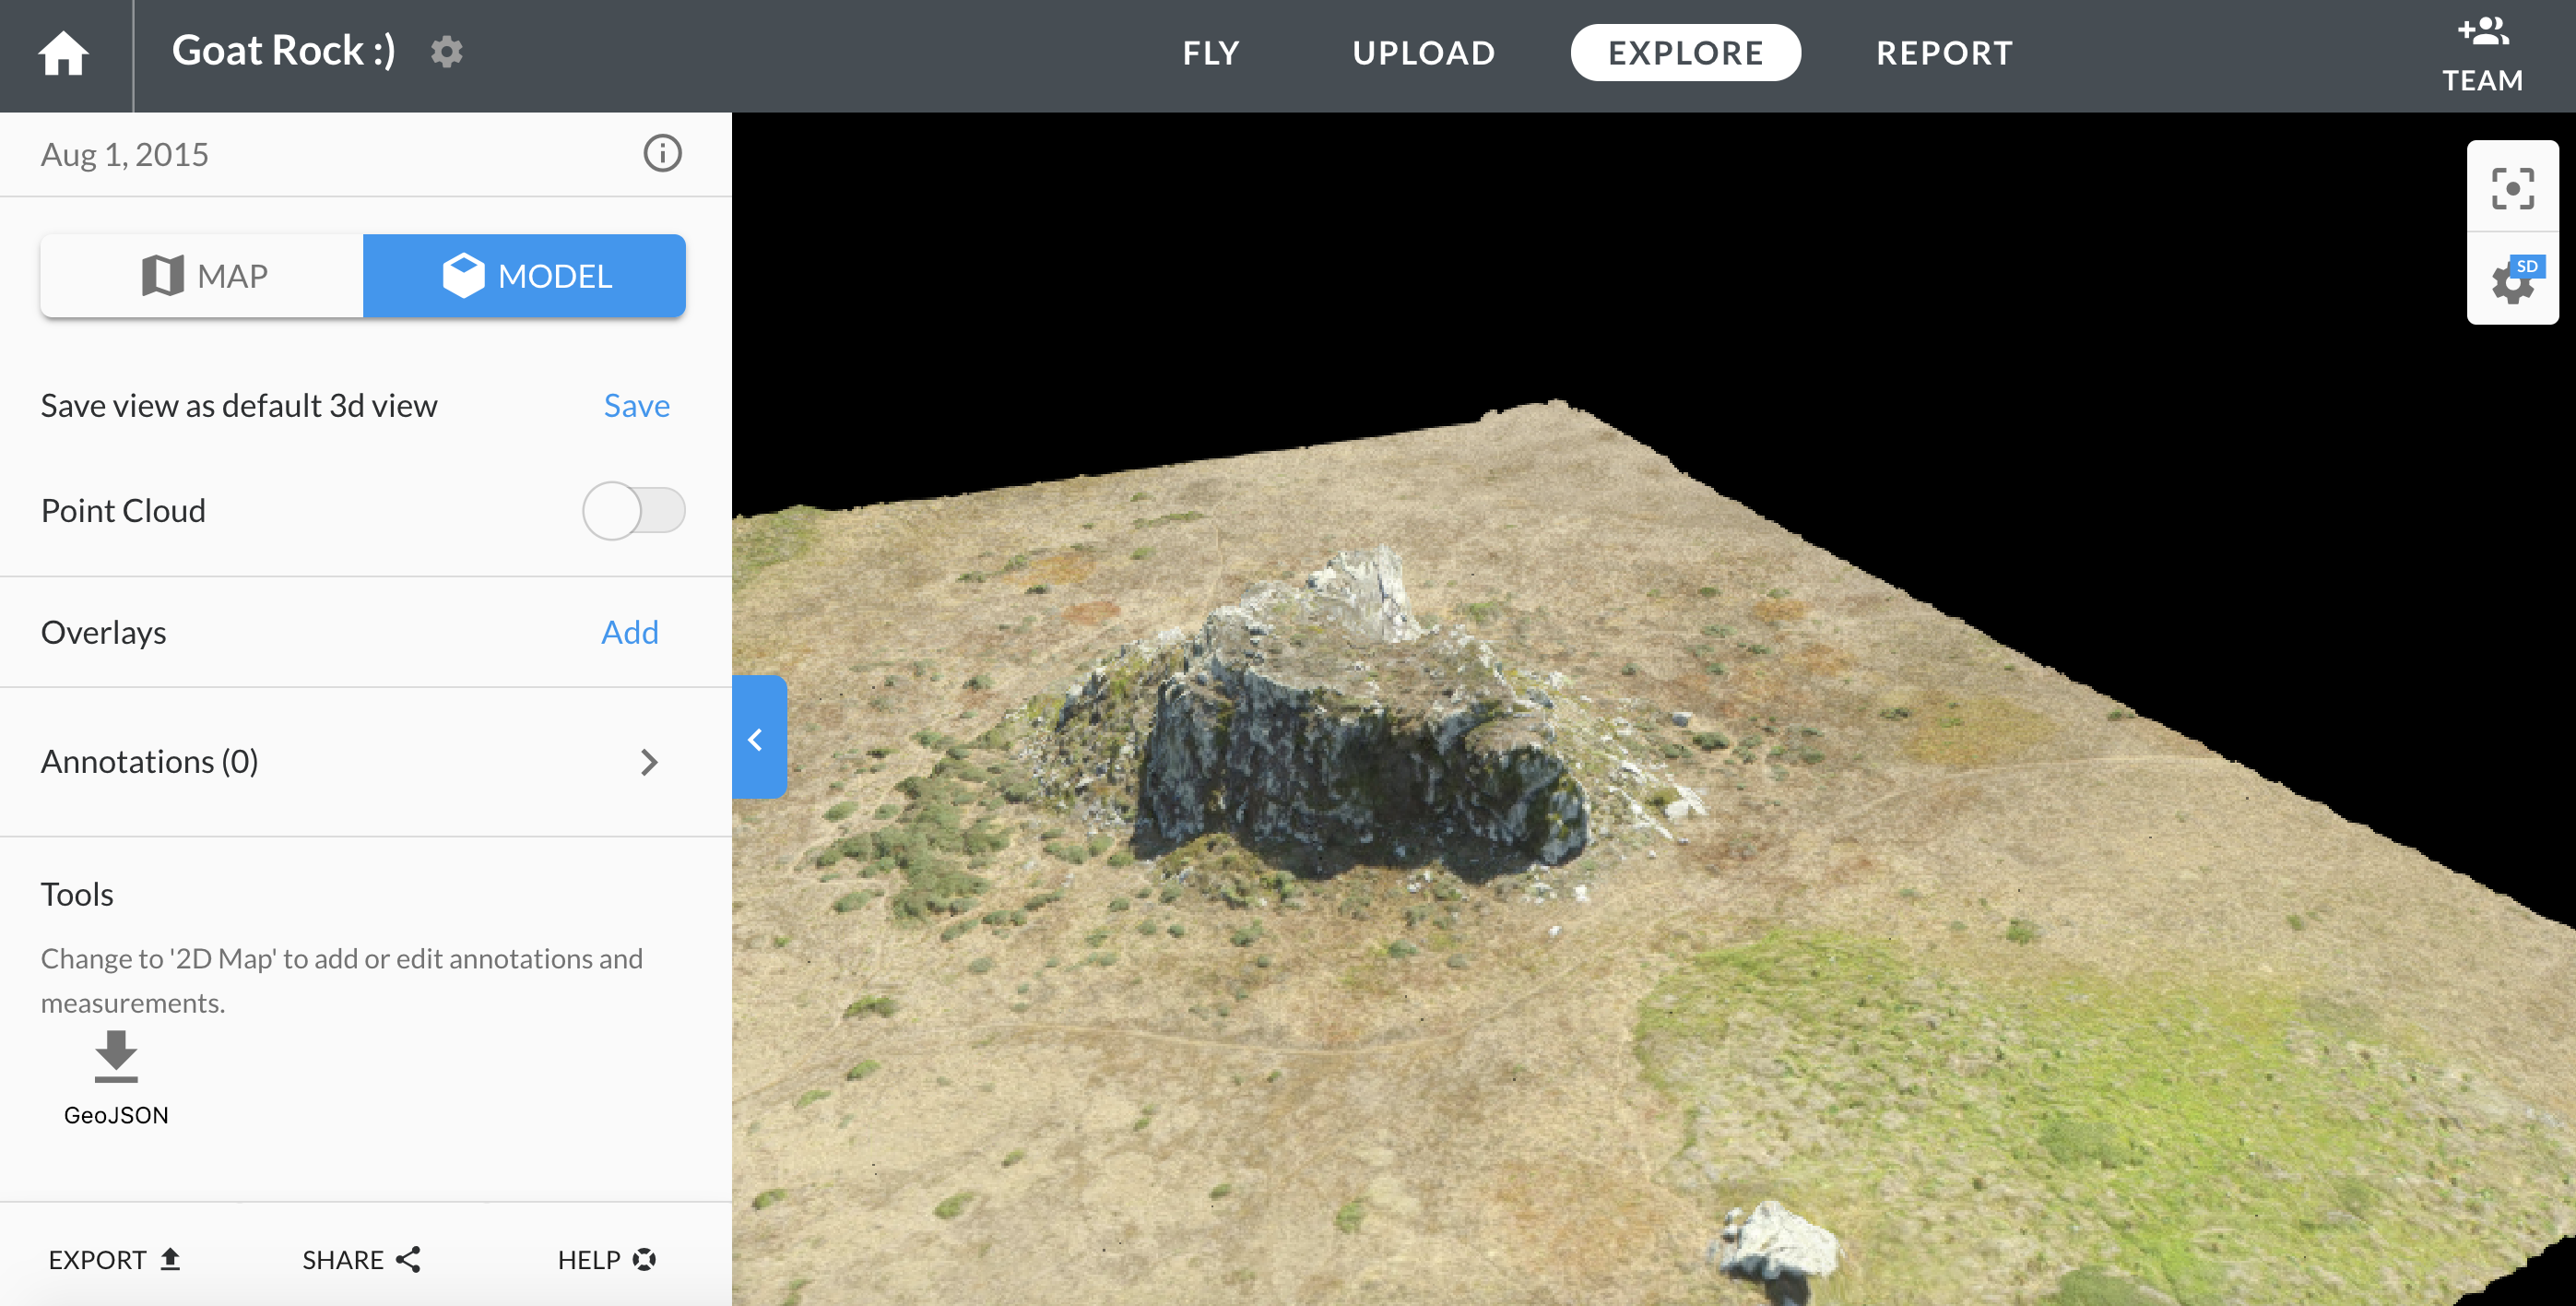
With our new layer selection interface your data is divided into 2 major sections, the Map and Model. Your Map section displays the different 2D layers of your map which you can turn and off. This includes the Orthomosaic, which is always on, and the Plant Health and Elevation layers which you can turn on and off. The Model section, when selected, will display your 3D model.
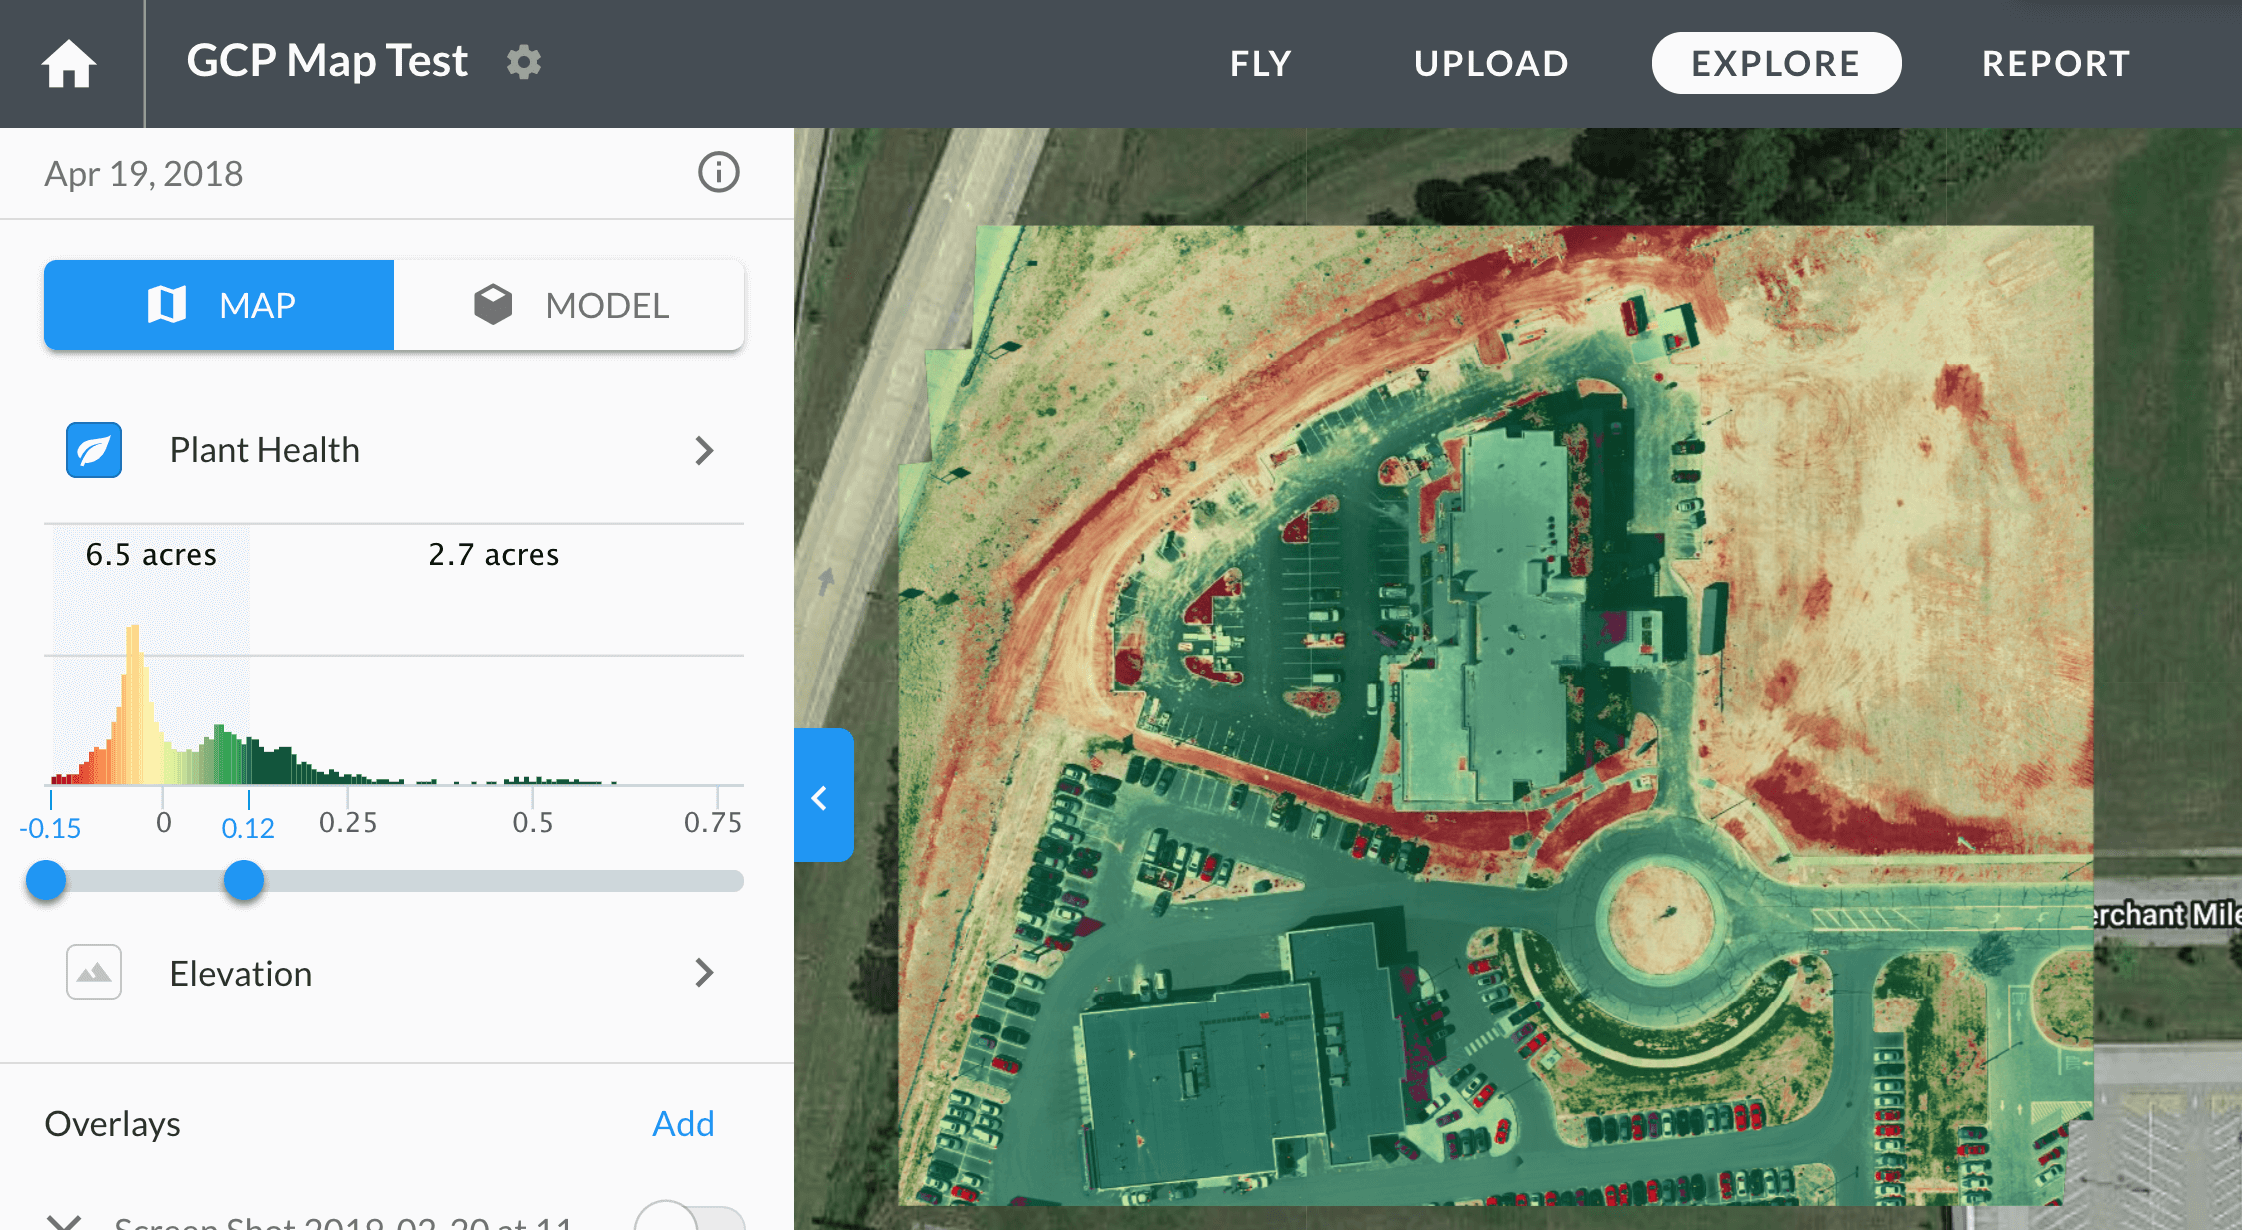
Display of the Map tab selected with the the Plant Health layer selected for viewing.
Orthomosaic
You can think of the 2D orthomosaic map as a birds-eye view of your area of interest. This view is selected when no other layers are displayed.
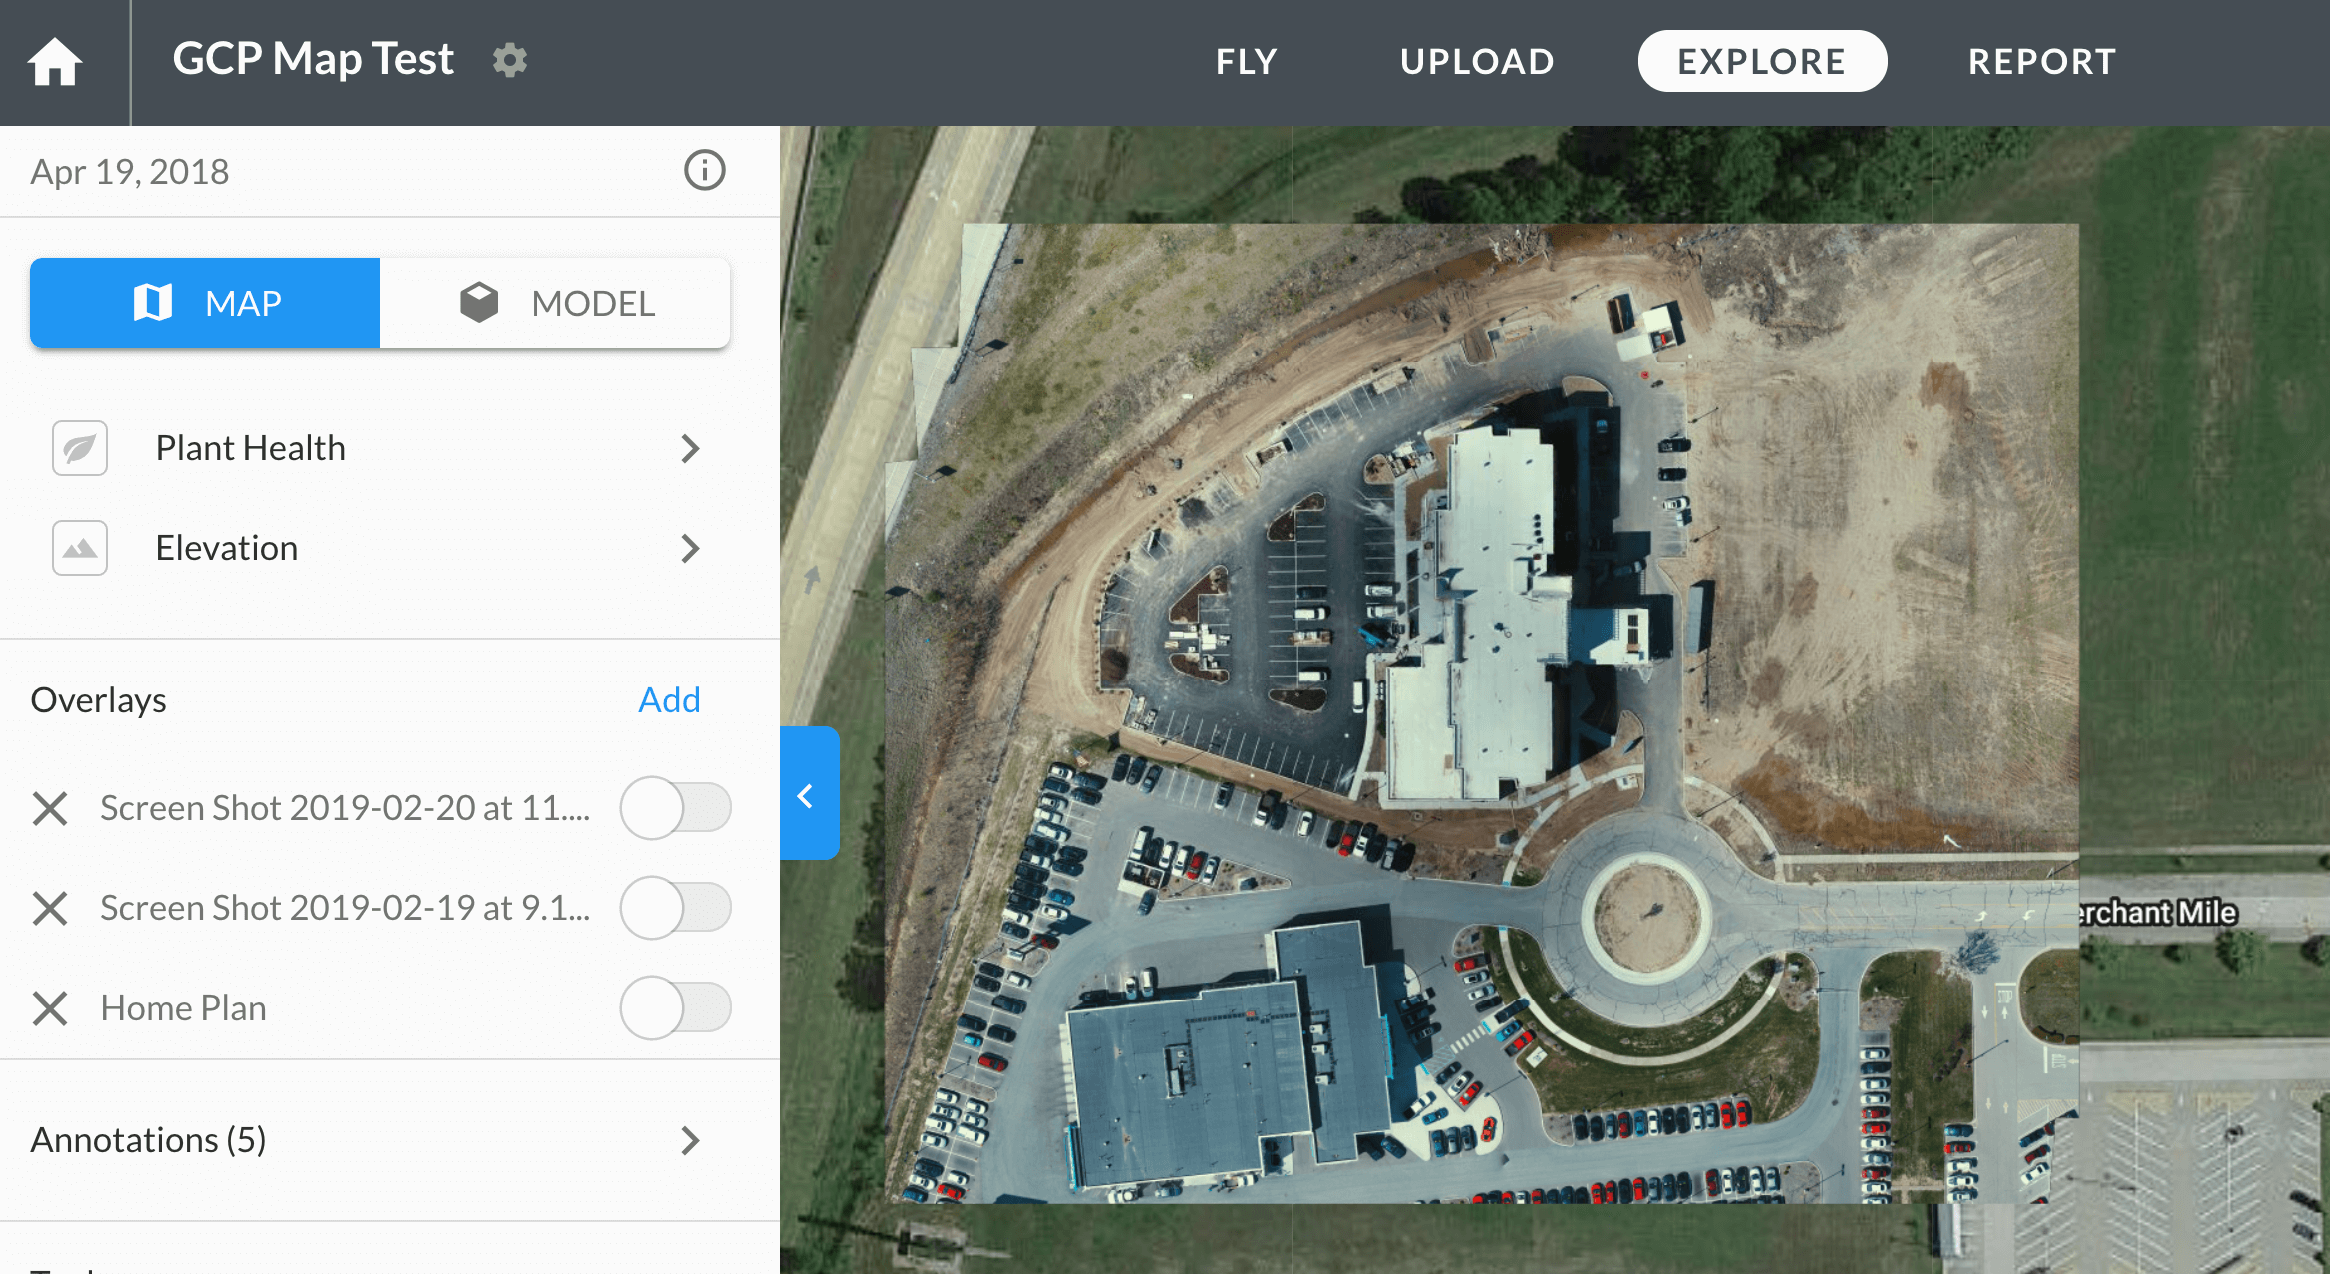
2D Orthomosaic example located within the Map Tab.
Plant Health
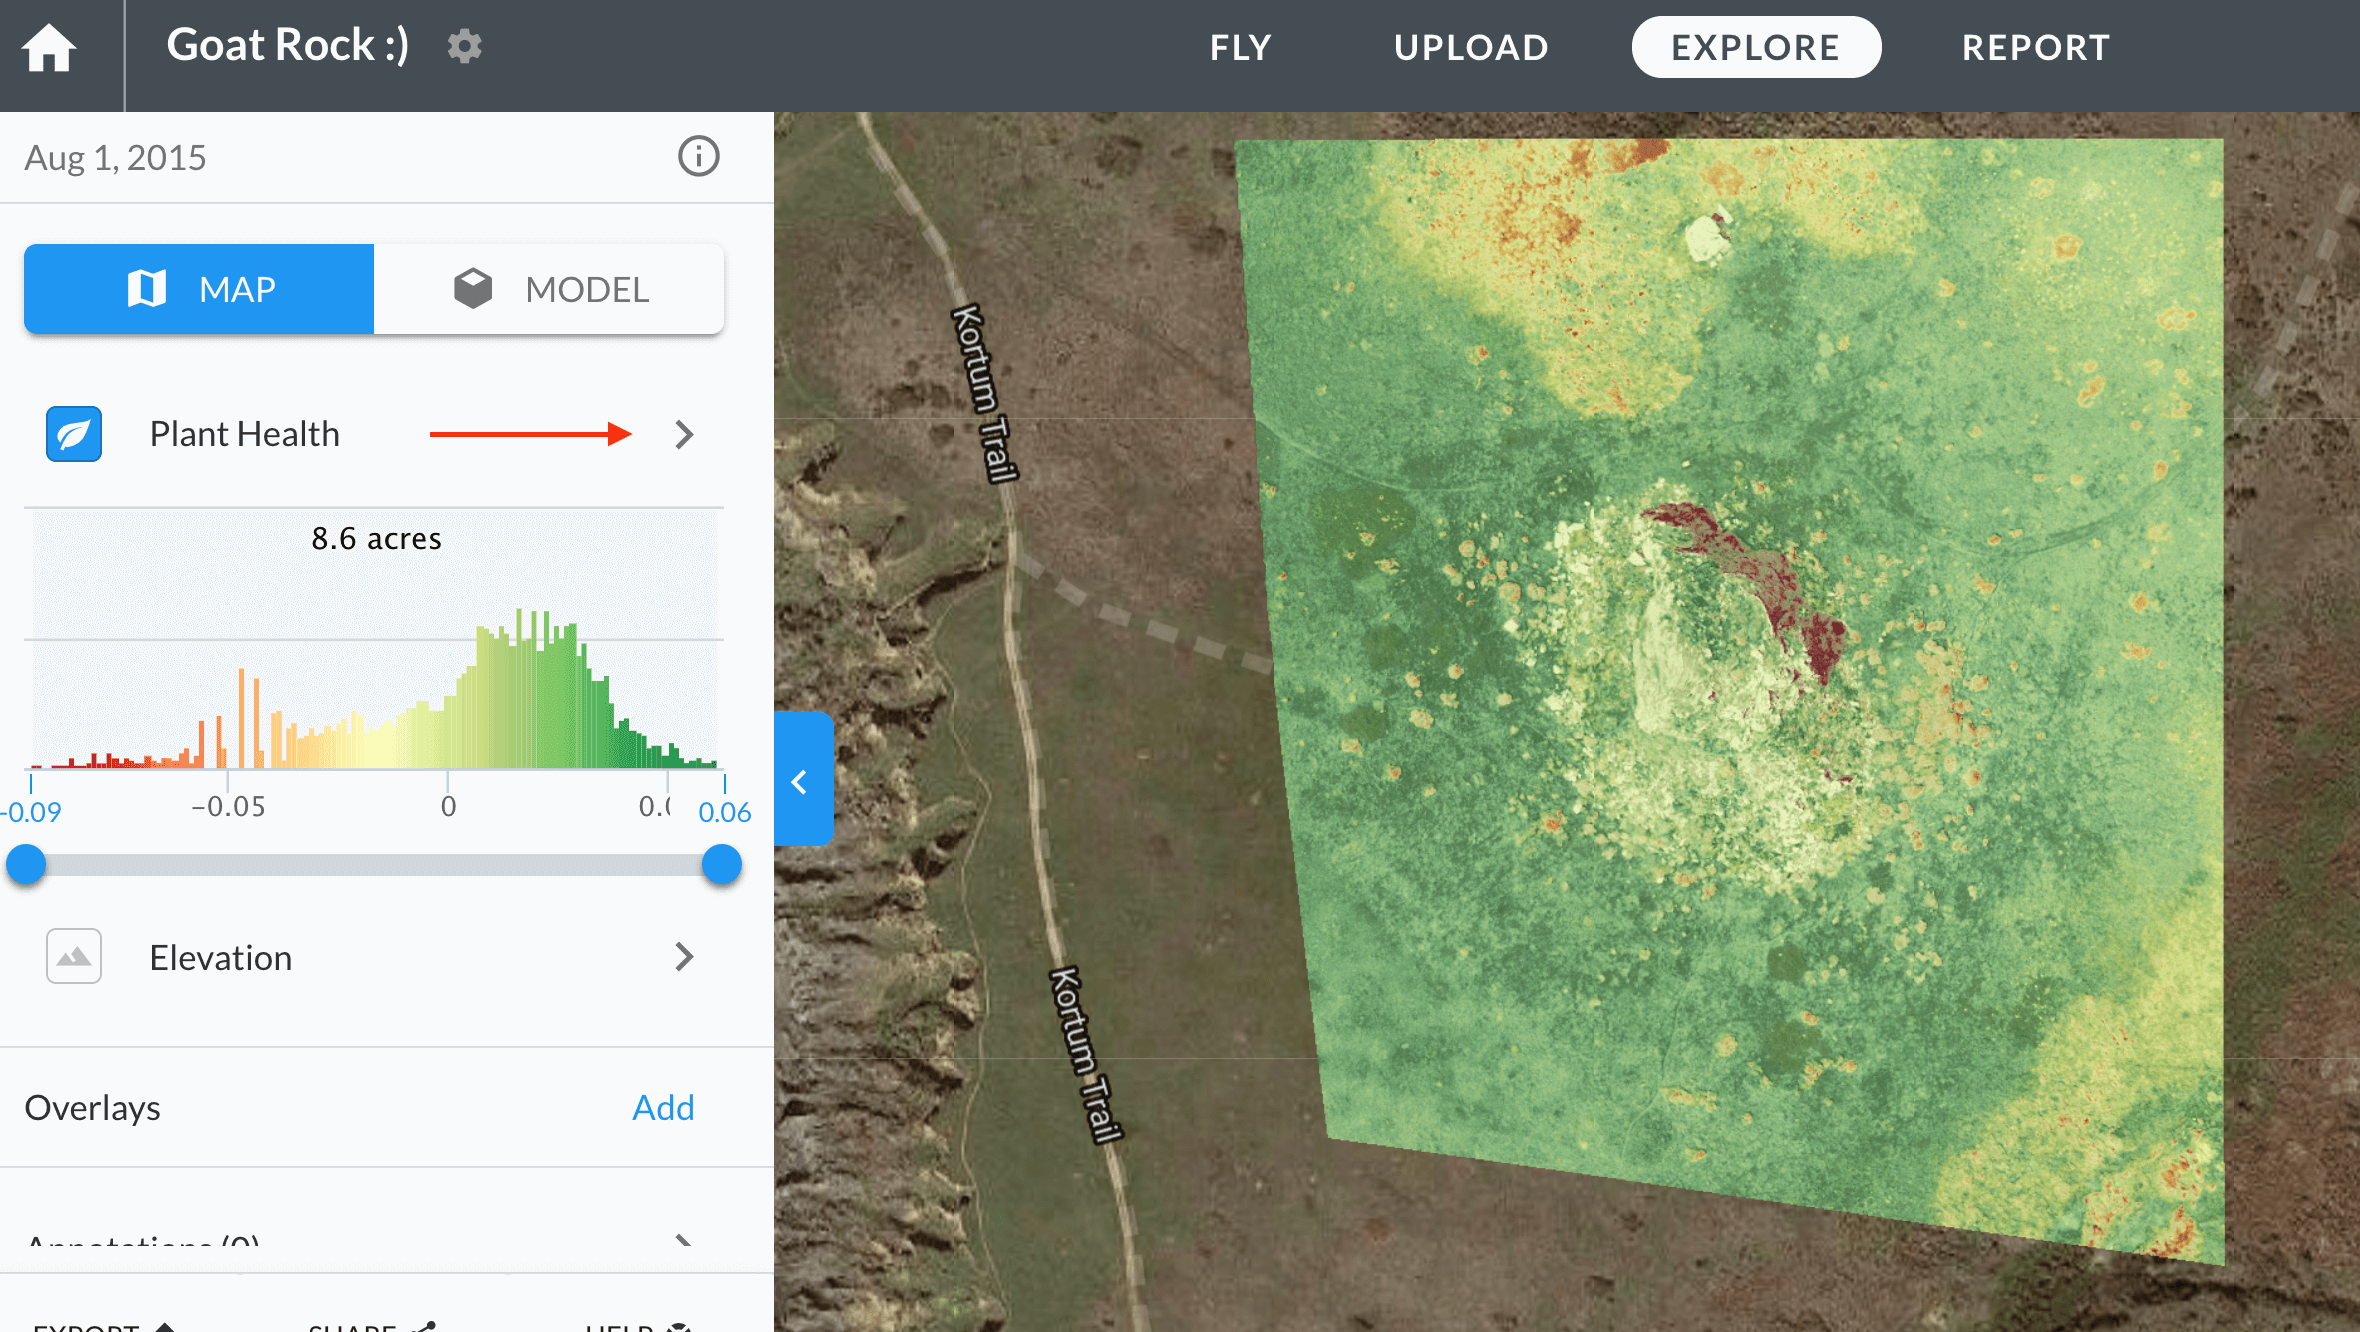
In turning on the Plant Health Layer, customers are able to explore agricultural data. With the Plant Health Layer selected, click on the arrow to the right of it for more Plant Health Tools.
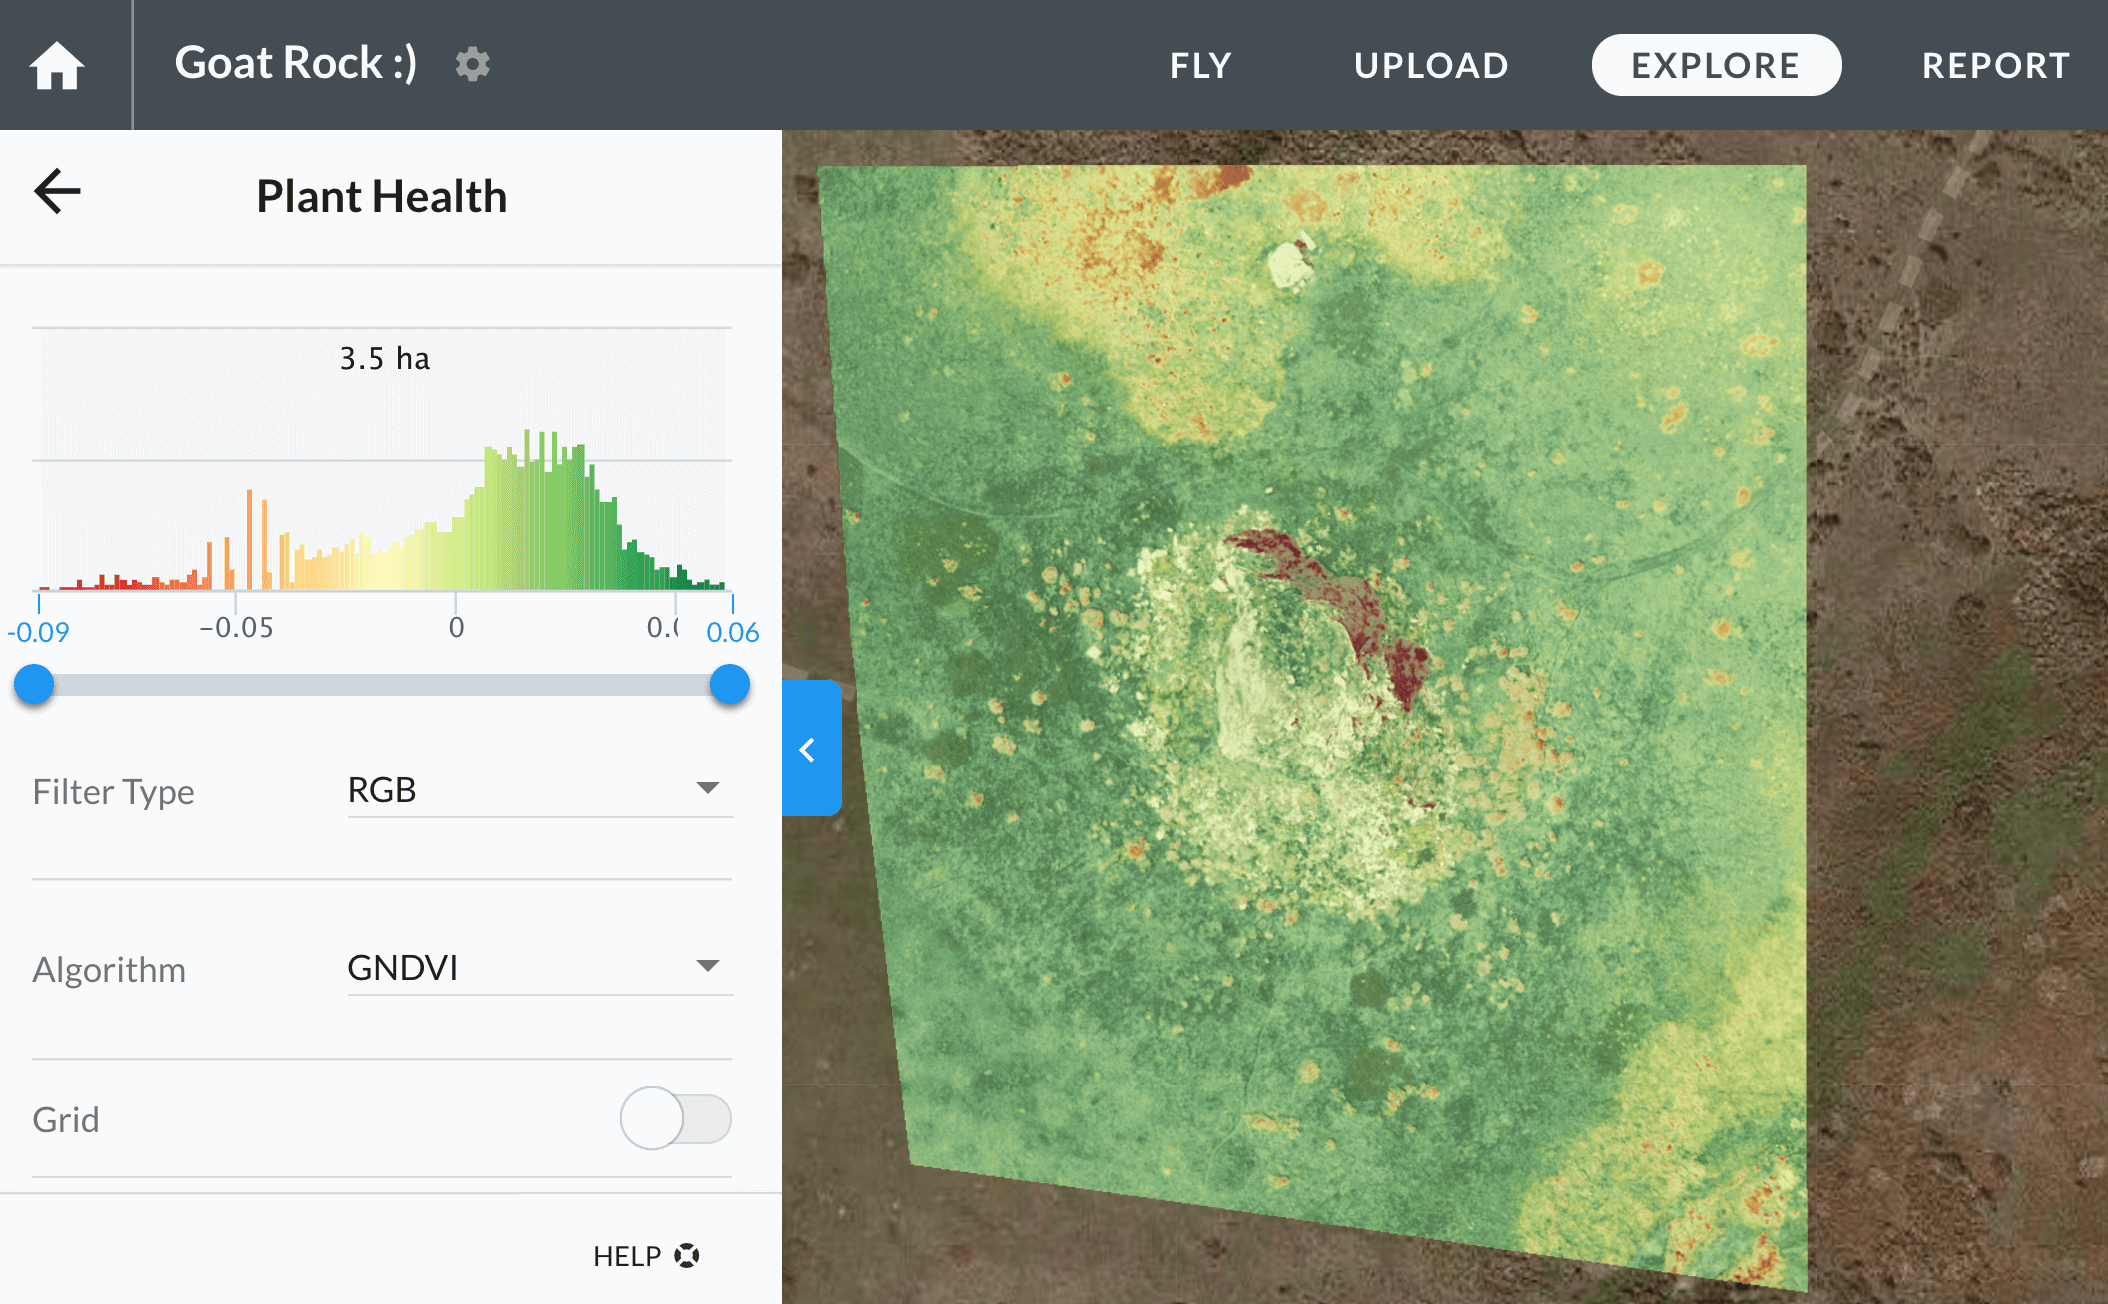
After clicking on that arrow, you enter the Advanced Plant Health screen which gives you more information such as a histogram, filter types and Algorithm settings.
If you scroll further down this panel, you can find an opacity slider which will allow you to change the transparency of this layer. If you would like to show more of another layer, for example, you would want to use the slider to lower the opacity of this layer.
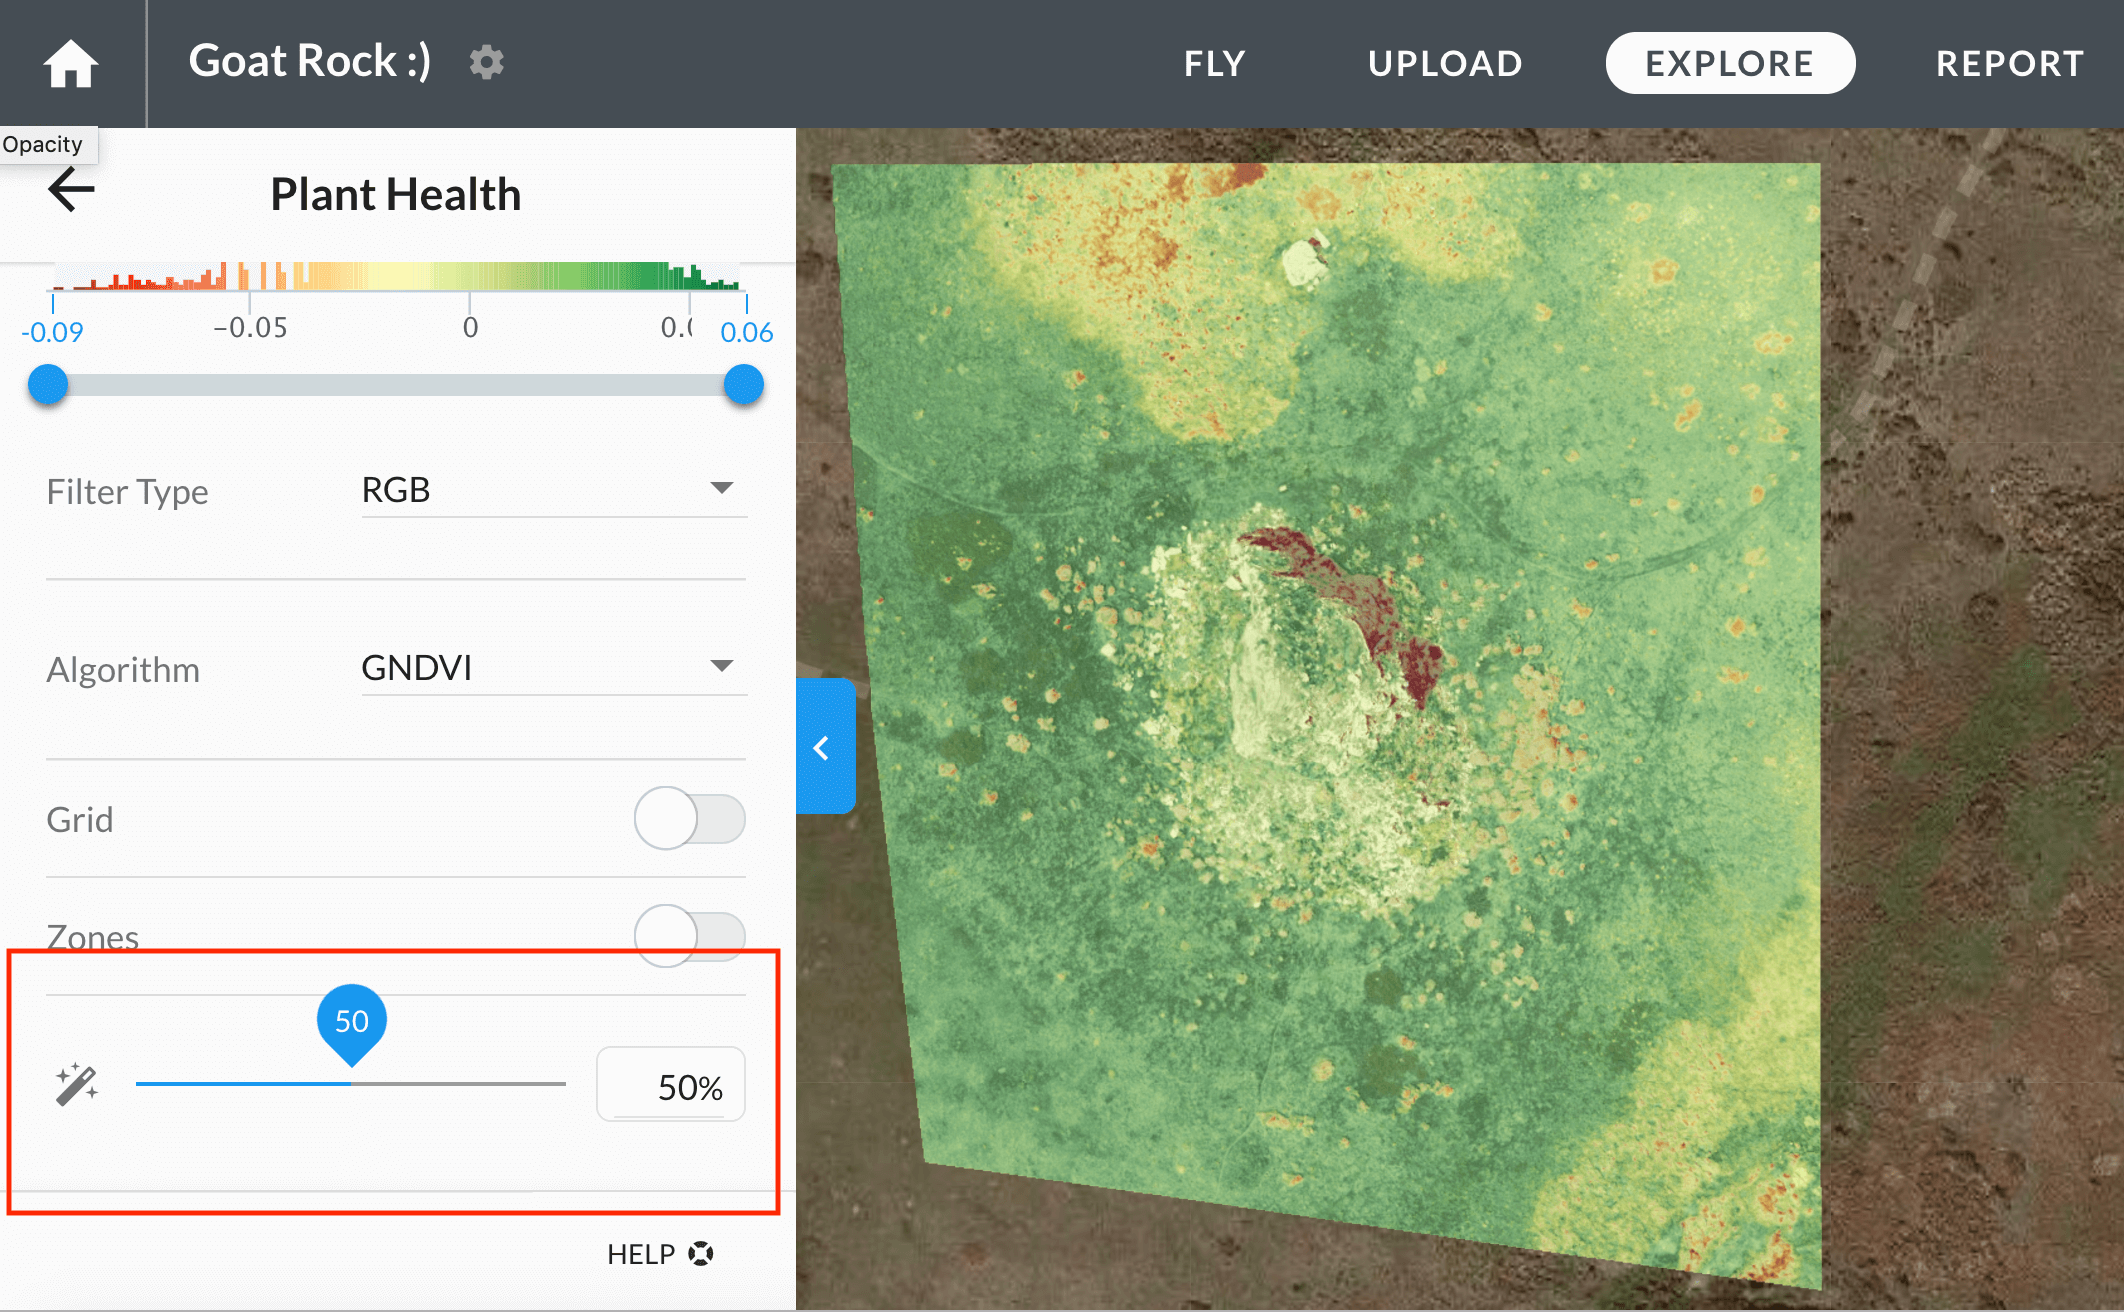
The opacity of this Plant Health layer is set to 50% so we are also able to see the orthomosaic at the same time.
NDVI layers
Normalized Difference Vegetation Index (NDVI) is a respected index for assessing vegetation health. If imagery is taken with a compatible camera, each pixel is assigned a color value within a range based on the formula that measures the relationship between bands of light. For more information, please see our explanation of NDVI Cameras for Drones.
Elevation
The elevation layer provides the digital surface model information used to measure and understand the elevations of your map. Please click here for a full explanation of the Elevation layer.
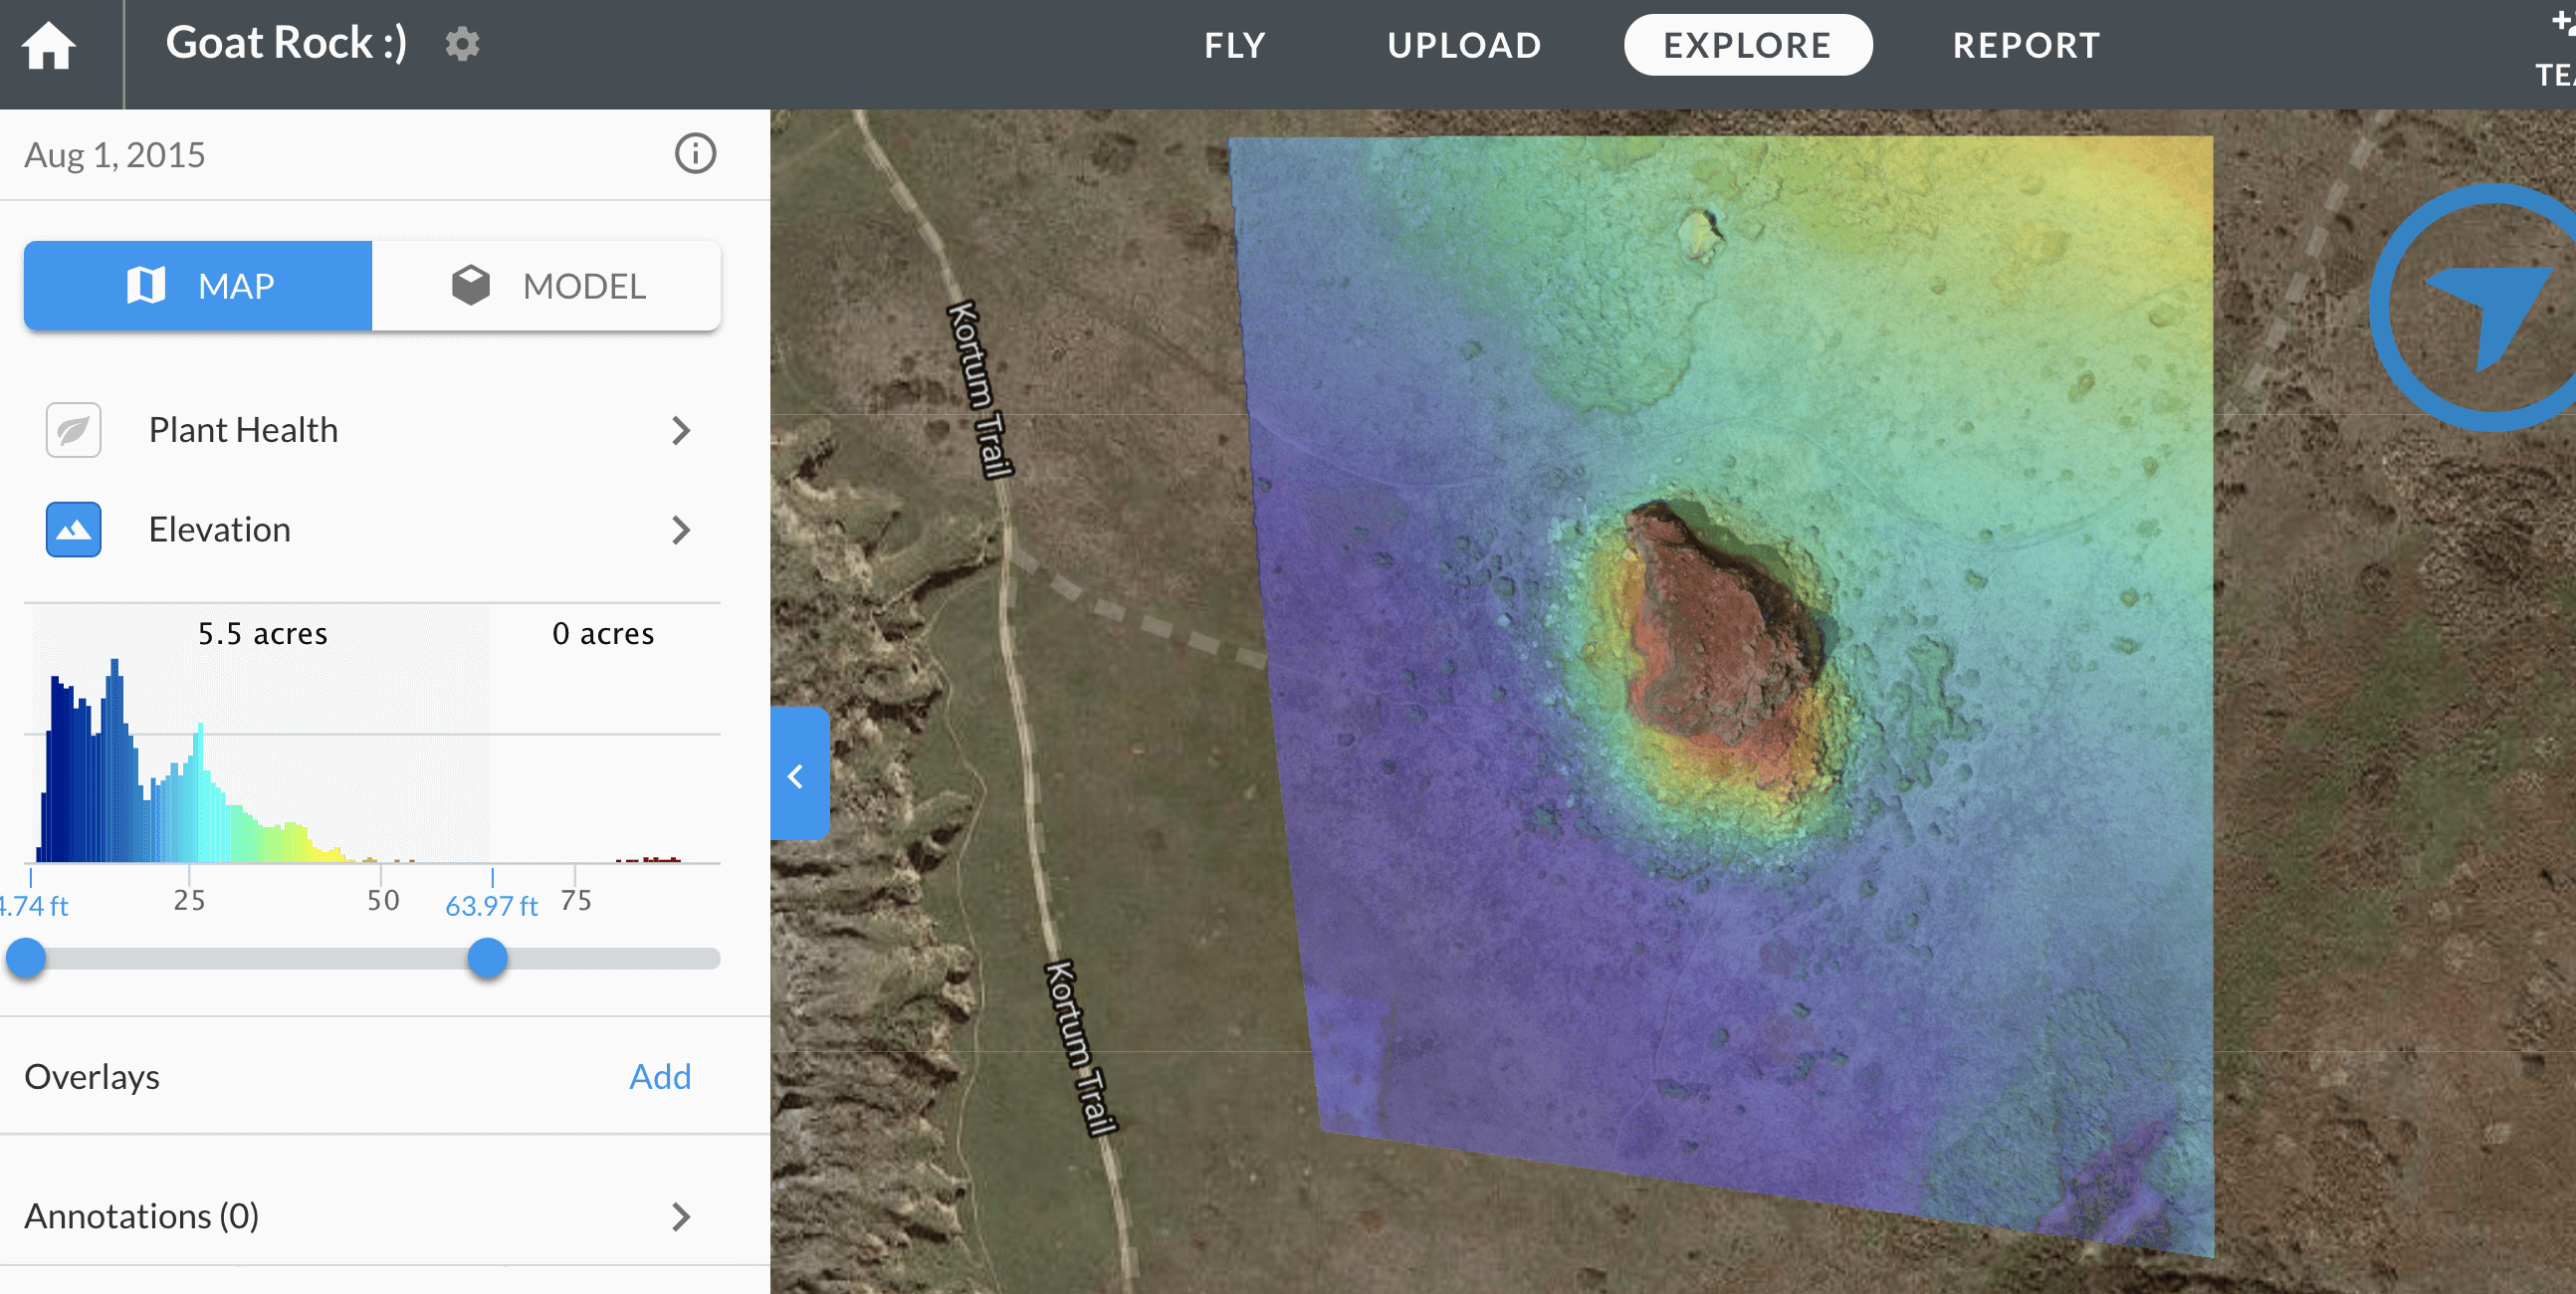
Just like in the Plant Health layer, if you click the arrow to expand to the Elevation panel, you will have more tools to access and the ability to change opacity.
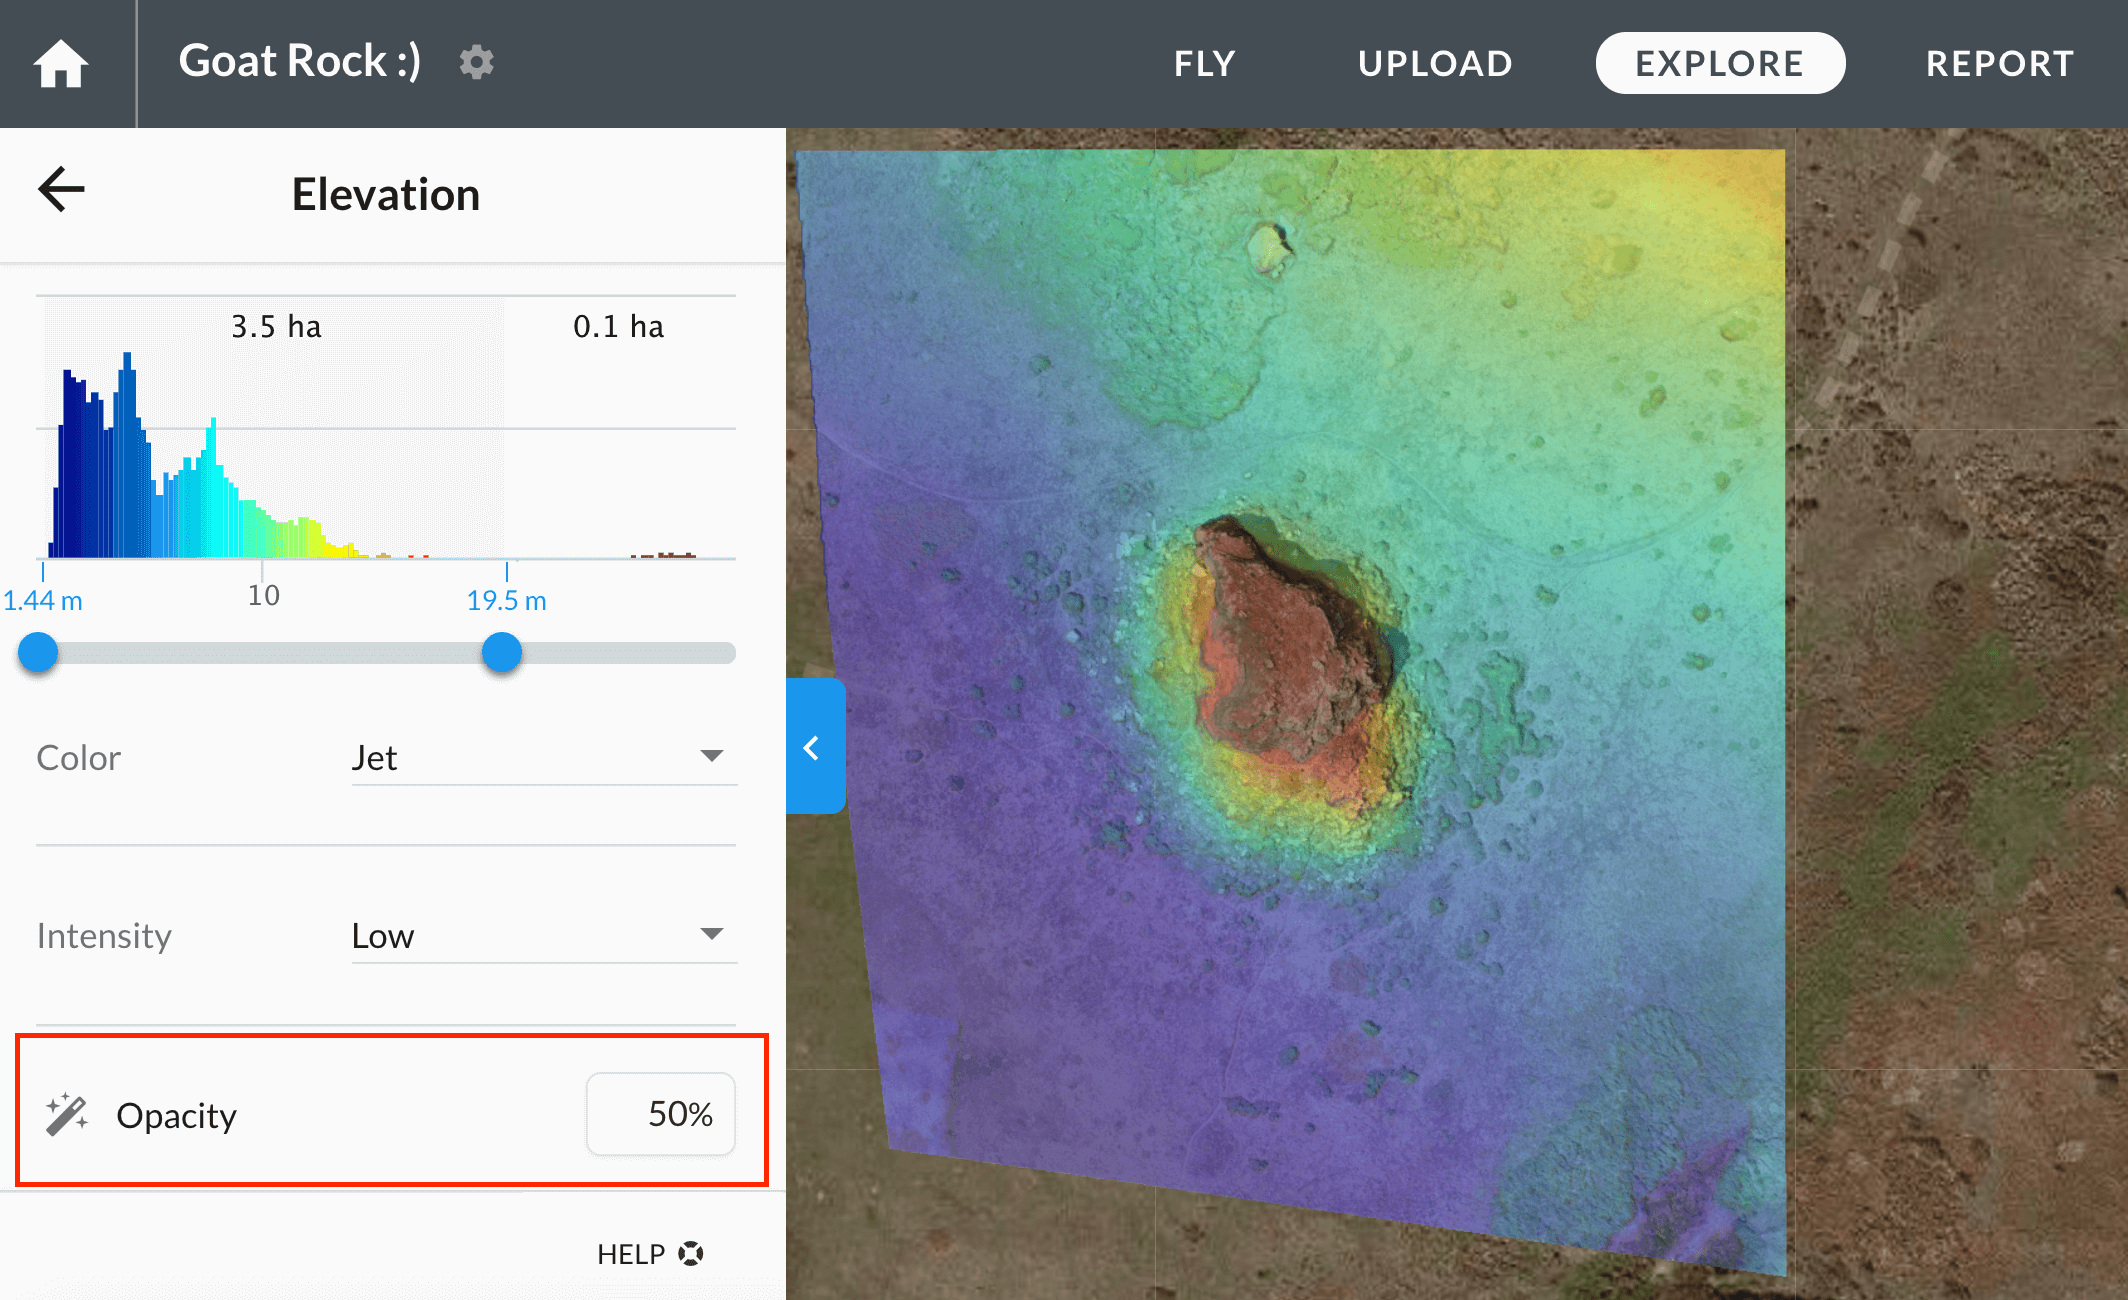
The opacity on the Elevation Layer is set to 50%, allowing viewers the ability to also view the orthomosaic layer.
Turning on Multiple Layers
With the ability to turn on multiple layers at the same time, and the ability to change opacity, users are able to view multiple layers at once. In doing so, users will be better able to contextualize there data visually.
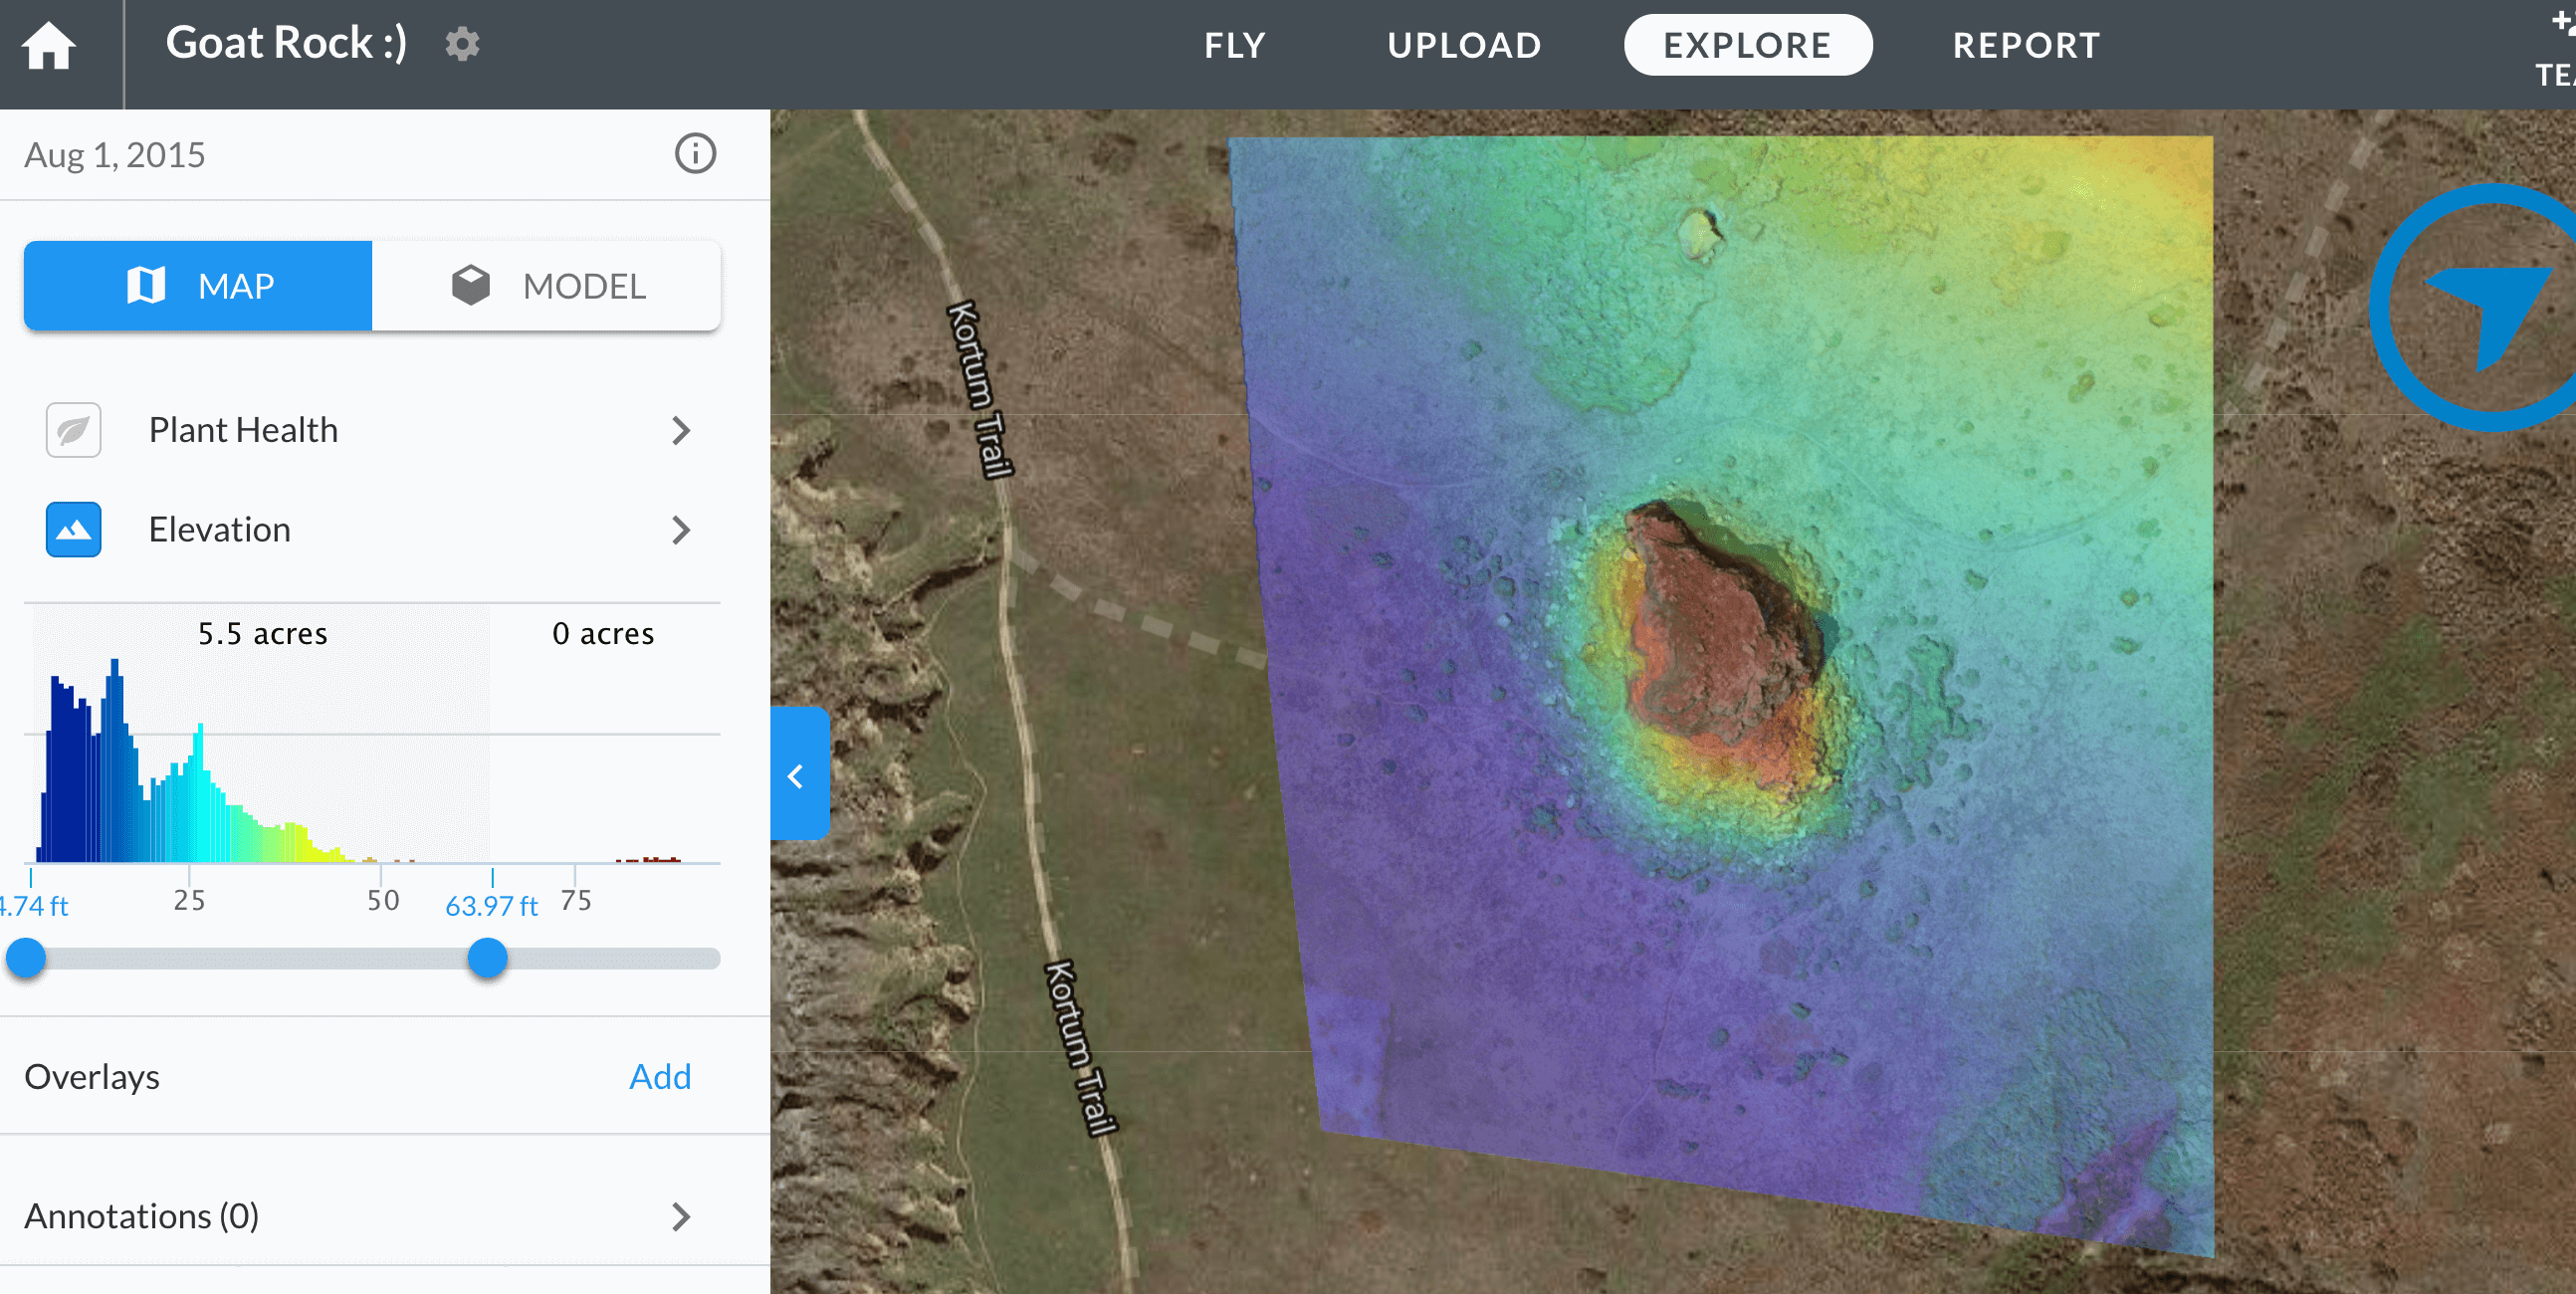
With the ability to see both the Elevation layer and the plant health layer we can contextualize our map better.
3D Model
The model section is a great interactive tool that visualizes your area of interest in a different space. There, you will be able save any view of the model you like and display the Point Cloud if applicable to your account.
Explore Maps of the Same Location
You can now easily explore maps between multiple maps in a location by clicking forward and back arrows to move to next and previous maps. This functionality is available to all users with maps in the same location.
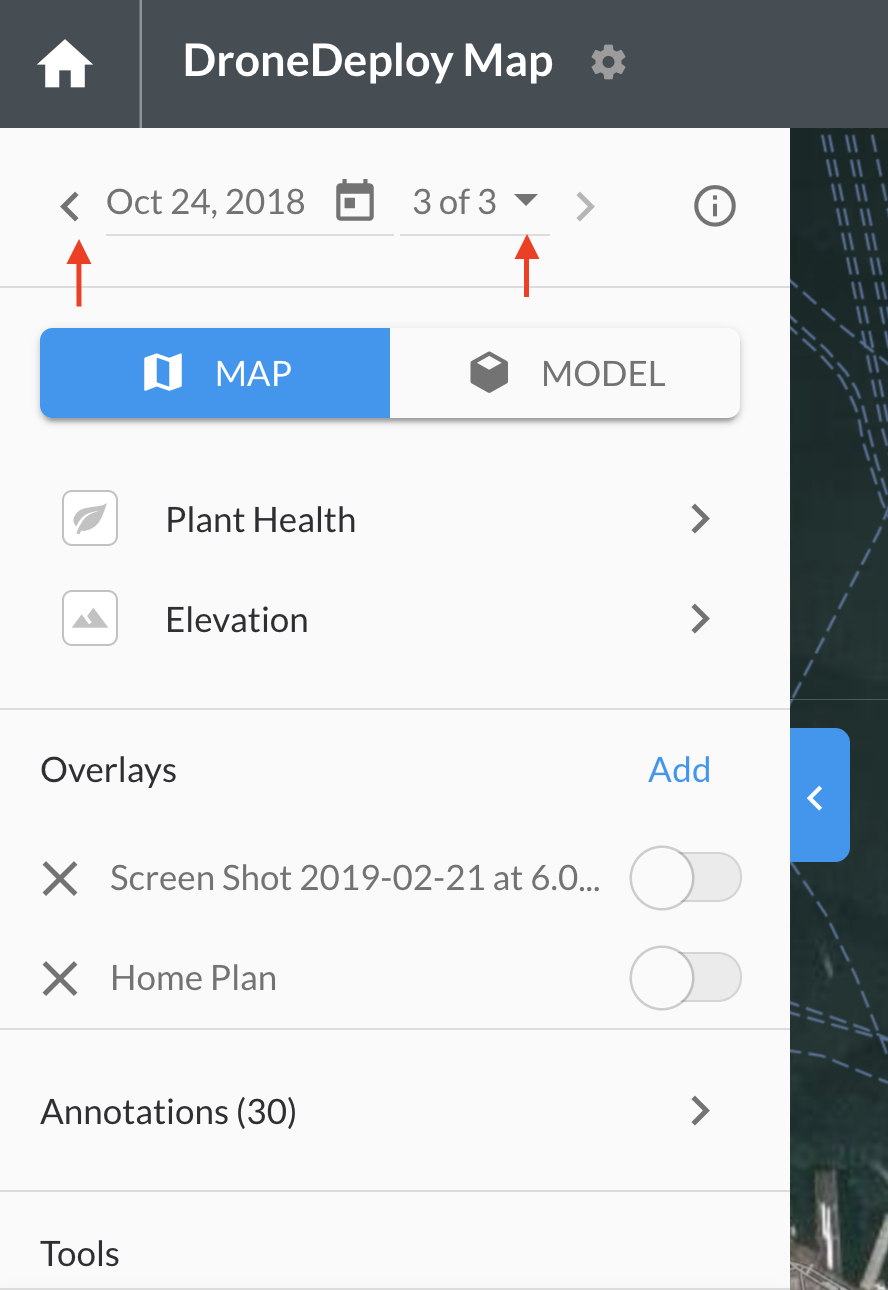
When you view a map of a location that has been mapped multiple times, you will see forward and back arrows and a calendar date picker. Just click the forward button to move to the next map in time and the back button to view the previous map.