How to Export Plant Health Data and Import into ArcGIS
Plant Health is an insightful tool that displays vegetation data for agricultural, forestry, and ecological users. It applies various vegetative indices to identify plant health and variability over a mapped area, enabling more informed decisions and immediate management. This analytical plant data is available to all customers subscribed to Individual, Advanced, Teams, or Enterprise plans.
This guide covers how to export Plant Health data as a Shapefile (SHP) and import it into ArcGIS for further spatial analyses.
Export Your Data
Follow the Exporting your Data guide and request a Plant Health export as a Shapefile.
Import the Plant Health SHP into ArcGIS
Download and Extract the Data
Upon receipt of your exported files in your email inbox, click the download link to get a zipped file containing your data.
When prompted, Save the file to your computer.
Locate the downloaded files on your computer. Using the file extraction method of your choice, extract the dataset from the zipped file.
Import the Shapefile
Open ArcGIS and start with a blank map.
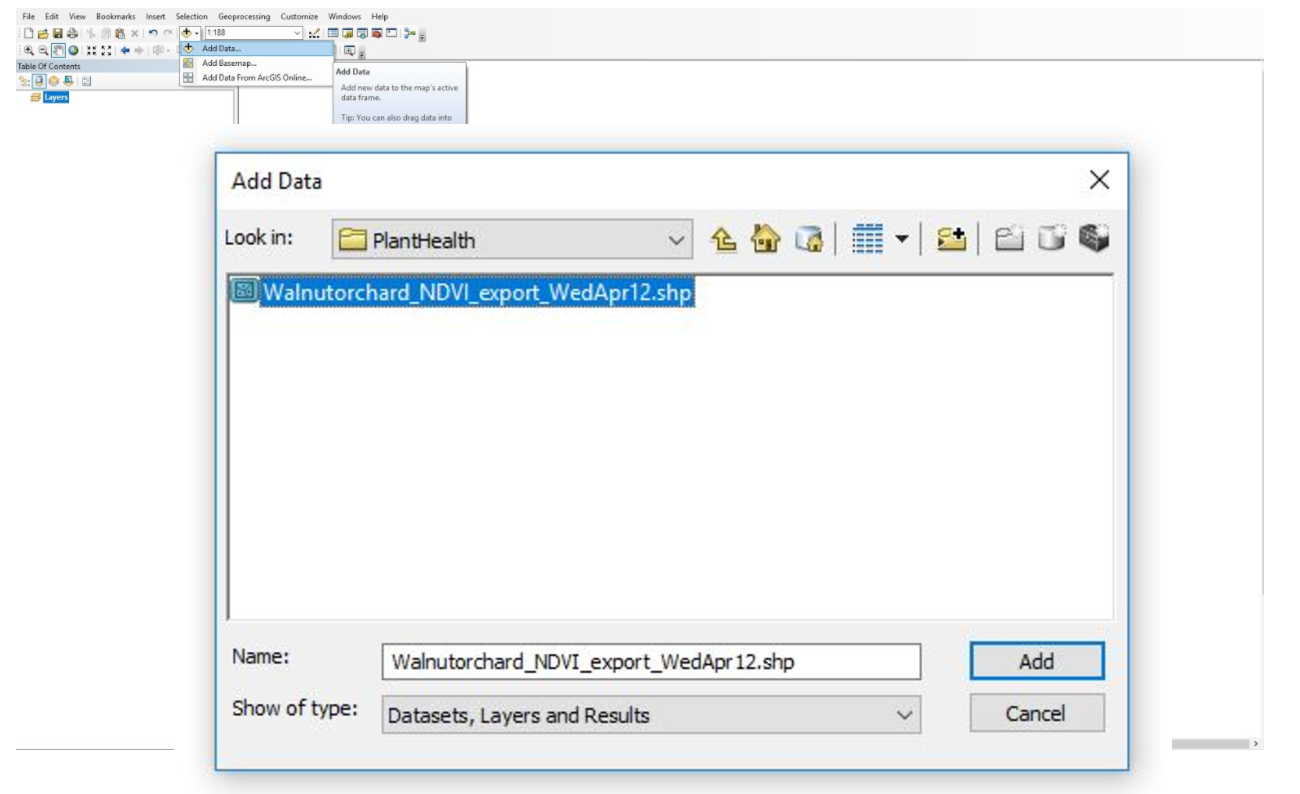
Next, click on the Add Data icon to import the Shapefile.
-
Select the file path to the Shapefile and select Add.
View the Attribute Table
-
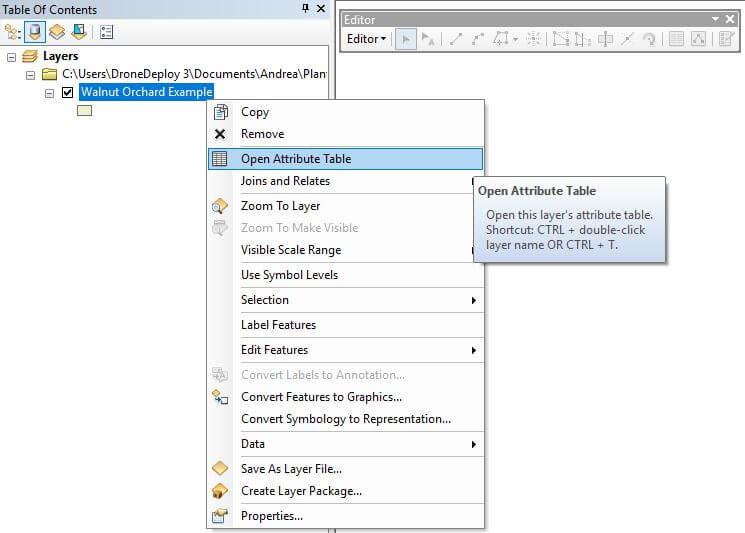
Under the Layers panel, right-click on the newly imported layer, and select Open Attribute Table.
Delete Background (Optional)
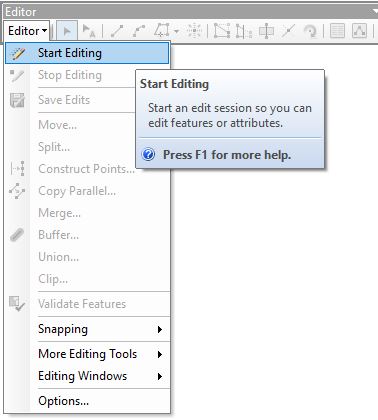
Click the Editor Toolbar button on the Standard toolbar to display the Editor toolbar.
-
From the Editor dropdown, select Start Editing to enable editing features or attributes.
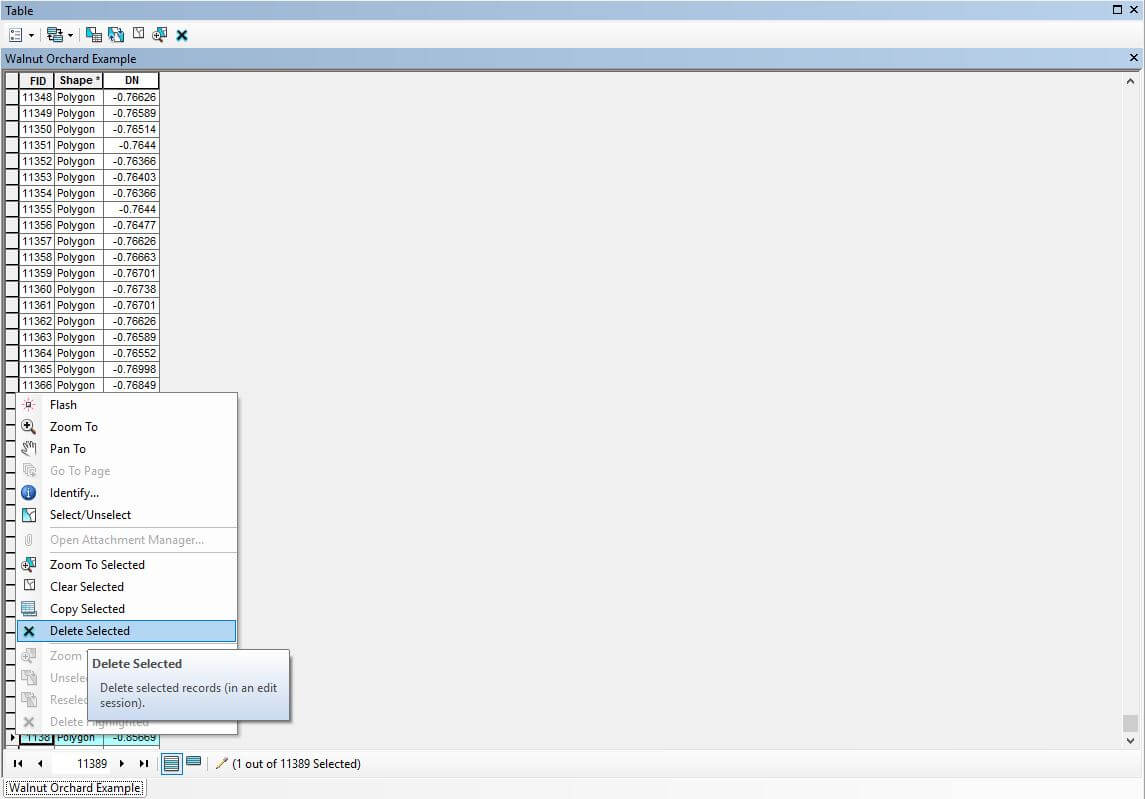
Open the Attribute Table again, scroll to the last polygon, and select the entire last row.
-
Right-click and select Delete Selected to remove the Shapefile boundary.
-
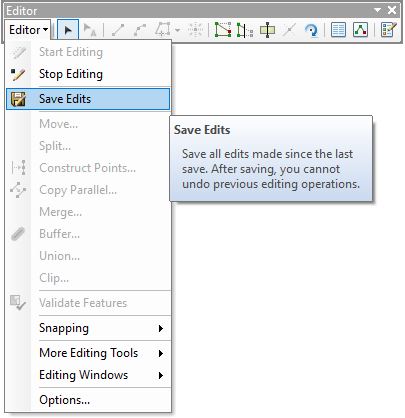
Navigate back to the Editor toolbar and select Save Edits from the dropdown. The Shapefile boundary is now removed to show only the applicable Plant Health attributes.
Classify the Map in Equal Interval
Right-click on the layer from your Layers panel to open Properties.
-
Navigate to the Symbology tab and show Quantities in Graduated Colors.
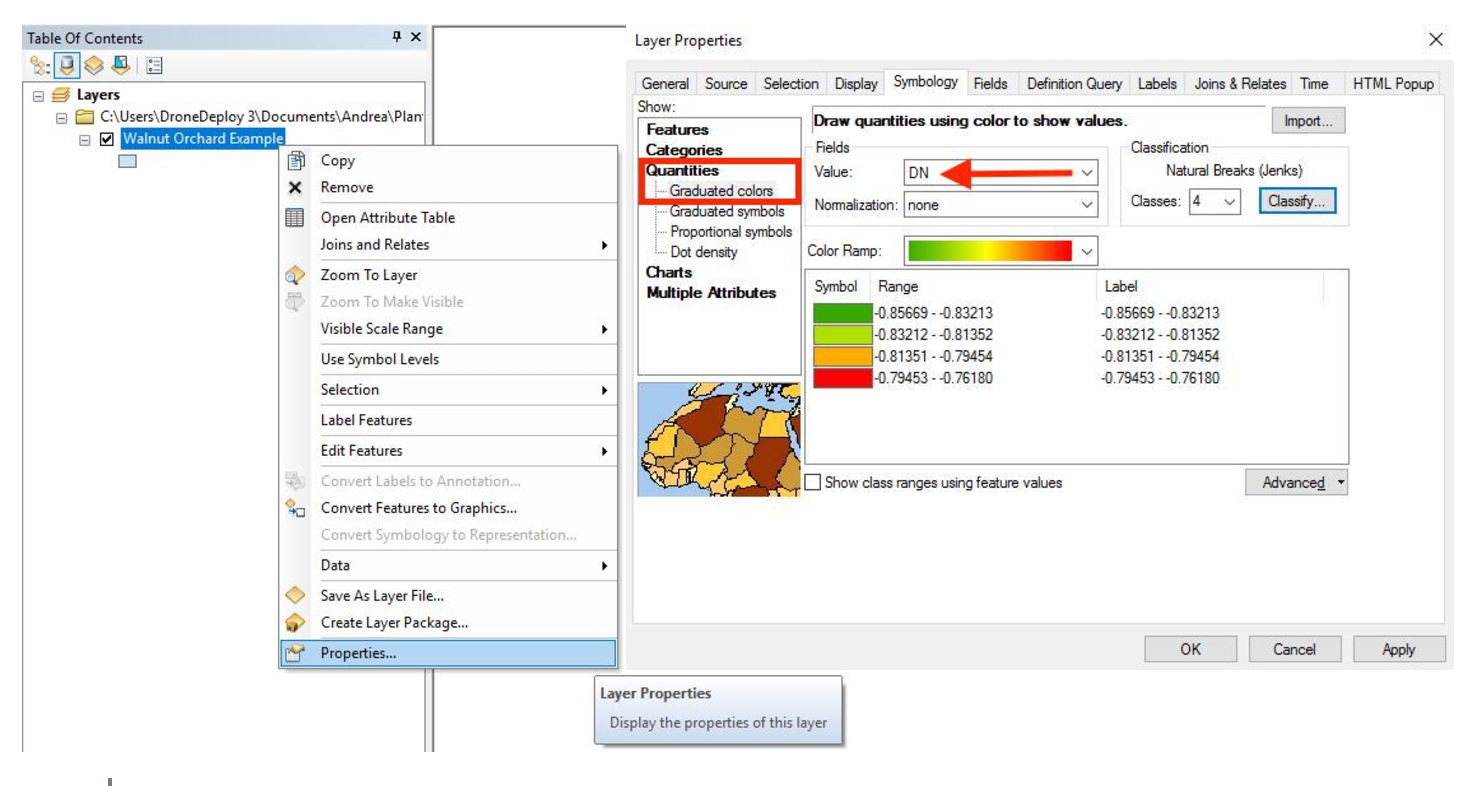
Select the number of Classes you wish to display, then select Classify.
-
Under the Classification Method dropdown, change the setting from Natural Jenks to Equal Interval.
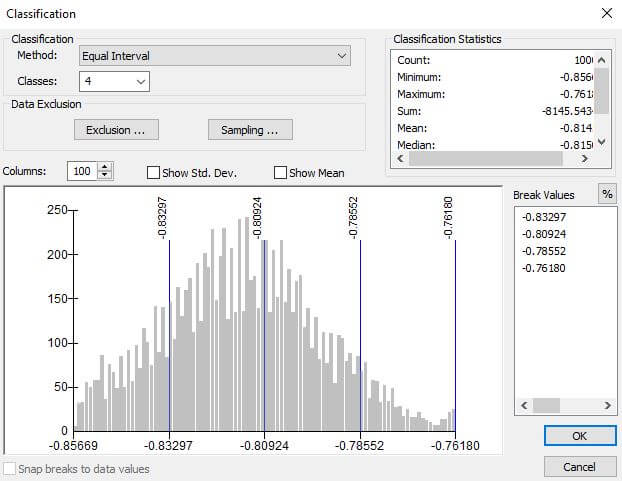
Select OK to finish.
Apply Color and Labels
-
You can now apply the Color Ramp to the desired gradient.
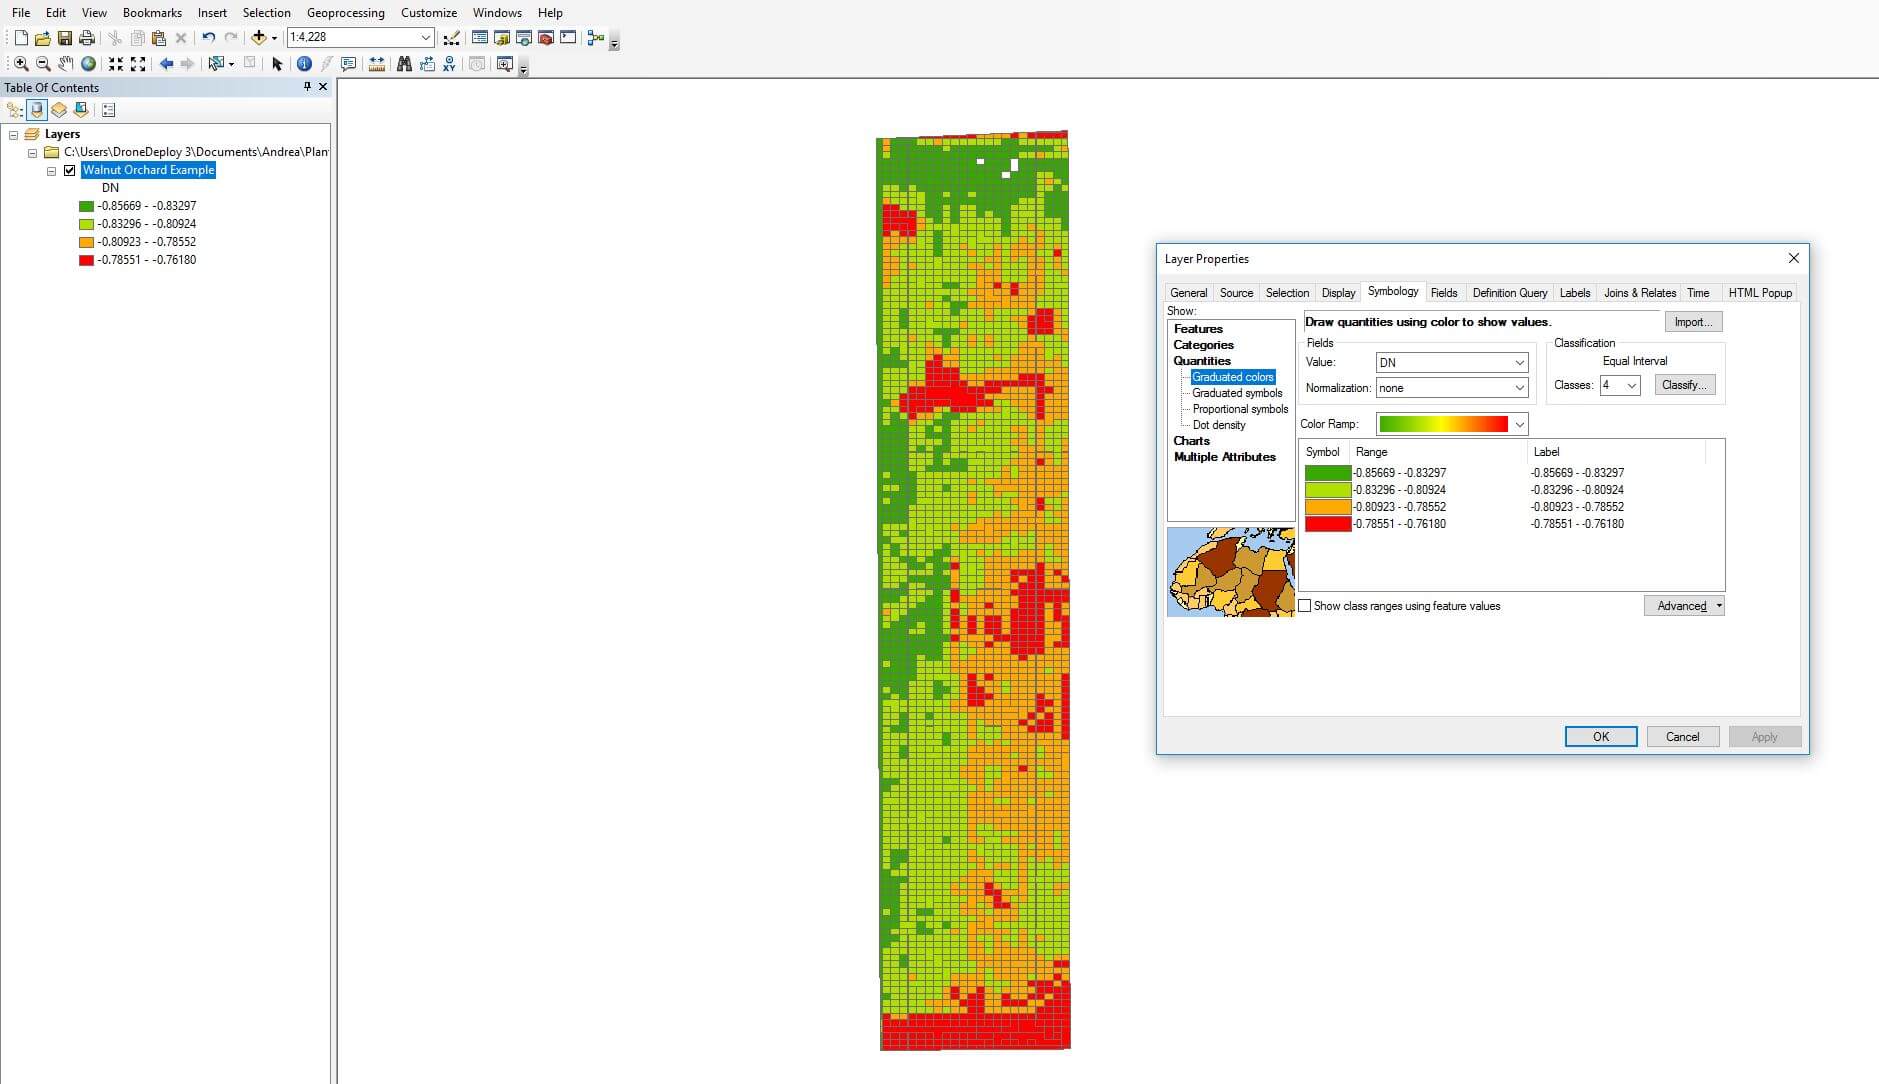
You can also change the Label of each value (this can be useful when creating a Legend).
Finally, select OK to finish.
You have now classified your Plant Health map in ArcGIS in Equal Interval to display your vegetation data.
V2.2