Overview
The Cut/Fill comparison toolset allows you to compare the elevation of one map to another map or to a design surface, such as a grading plan. This feature uses heatmap visualization to help you identify where soils require cutting or filling, allowing for efficient earthmoving progress monitoring.
As long as your project contains more than one map or a design surface, you have access to the Cut/Fill Map Analysis layer. When you select this layer, an adjustable color spectrum and elevation bands appear over your map. This spectrum visualizes the elevation difference between your datasets, such as a Map vs. Design surface.
Cut (Orange/Red): Areas that require material removal to reach the design elevation.
Fill (Cyan/Blue): Areas that require material addition to reach the design elevation.
Tolerance: Regions within .2ft of the design surface appear transparent.
Availability: Who has access?
Advanced, Teams, and Enterprise subscriptions have access to the Cut/Fill comparison tool.
The project must contain at least two maps or an uploaded design surface to enable comparison functionality.
Accessing the Cut/Fill Layer
Open your project in DroneDeploy.
Navigate to the Layers tab on the sidebar.
Click the Cut/Fill toggle under the Map Analysis section.
Cut/Fill Map Analysis Layer Overview:
|
|
Cut/Fill Layer First drop-down: map within the project Compare to Second drop-down:
Include trees and other objects (Digital Surface model): toggle ON if you want to include the DSM data Color Spectrum:
Opacity slider: brighten or fade the visualization colors Visualization Range +/-:
Allowed Tolerance +/-:
Data:
Both Cut and Fill will always be shown as positive.
|
Calculations in Detail:
- All volume calculations will be measured as a maximum of an absolute number of CUT or FILL
- Material Volume = absolute |CUT| volume or |FILL| volume.
- If you are measuring a stockpile, your Material Volume = |CUT|.
- If you are measuring a pond or a dip, your Material Volume = |FILL|.
- When comparing datasets, Cut and Fill are expressed in terms of what would need to be cut or filled to match the previous dataset. You can think of this as "proposed cut" and "proposed fill". For example, areas where my map is higher than the design plan would be colored red for "cut", meaning that earth would need to be "cut away" to reach design elevations. The below visual is a good representation of this.

Surface in Detail: Digital Terrain Model or Digital Surface Model
When you view the Cut/Fill layer, you can either compare the Digital Surface Models or the Digital Terrain Models.
- Comparing the Digital Surface Models can be useful to detect differences in structures, equipment, or vegetation from dataset to dataset.
- Comparing the Digital Terrain Models is useful for visualizing changes in terrain due to earthmoving.
Compare in Detail:
- By default, the color spectrum will show the elevation comparison between the map you are viewing and the previous map within the project, but if you would like to compare to a different map or Design Surface, you can make that selection from the Compare to and Previous Map drop-down lists.
- See: Uploading a Design File for Cut/Fill Analysis & How to Create 2D/3D Visualization DXFs and Design Surfaces in Civil 3D
- The comparison map selected on the Cut/Fill details page will also be reflected in your Cut/Fill Export.
Measuring Specific Areas
The general overview shows total volume differences for the entire overlapping area. To measure a specific region:
Select the Volume tool from the Annotations tab.
Outline the area of interest.
In the measurement details, select Previous Map or Design Plan as the base plane.
Toggle the Cut/Fill layer while creating the annotation to better visualize elevation differences.
How to Quantify Cut/Fill Using Volume Comparison:
The Cut/Fill details overview shows the total volume difference expressed as Volume to Cut, Volume to Fill, and Total Volume to move, and Net Volume between the two datasets compared (within the area they overlap).
However, the area of overlap may include more than the area of earthmoving that you want to track. Use the Volume Measurement annotation to measure the volume difference between two datasets within a specific area.
Create your Volume annotation and select Previous Map as a base plane.
- Turn on the Cut/Fill layer while making the Volume annotation to help you visualize the elevation difference between the two datasets
Example: excavation area on two different days. When comparing the elevations from each date, you can see that more of the area has been excavated by the second date. We can calculate that over 1,527.95 cubic yards have been excavated in that area between May 4th and August 14th.
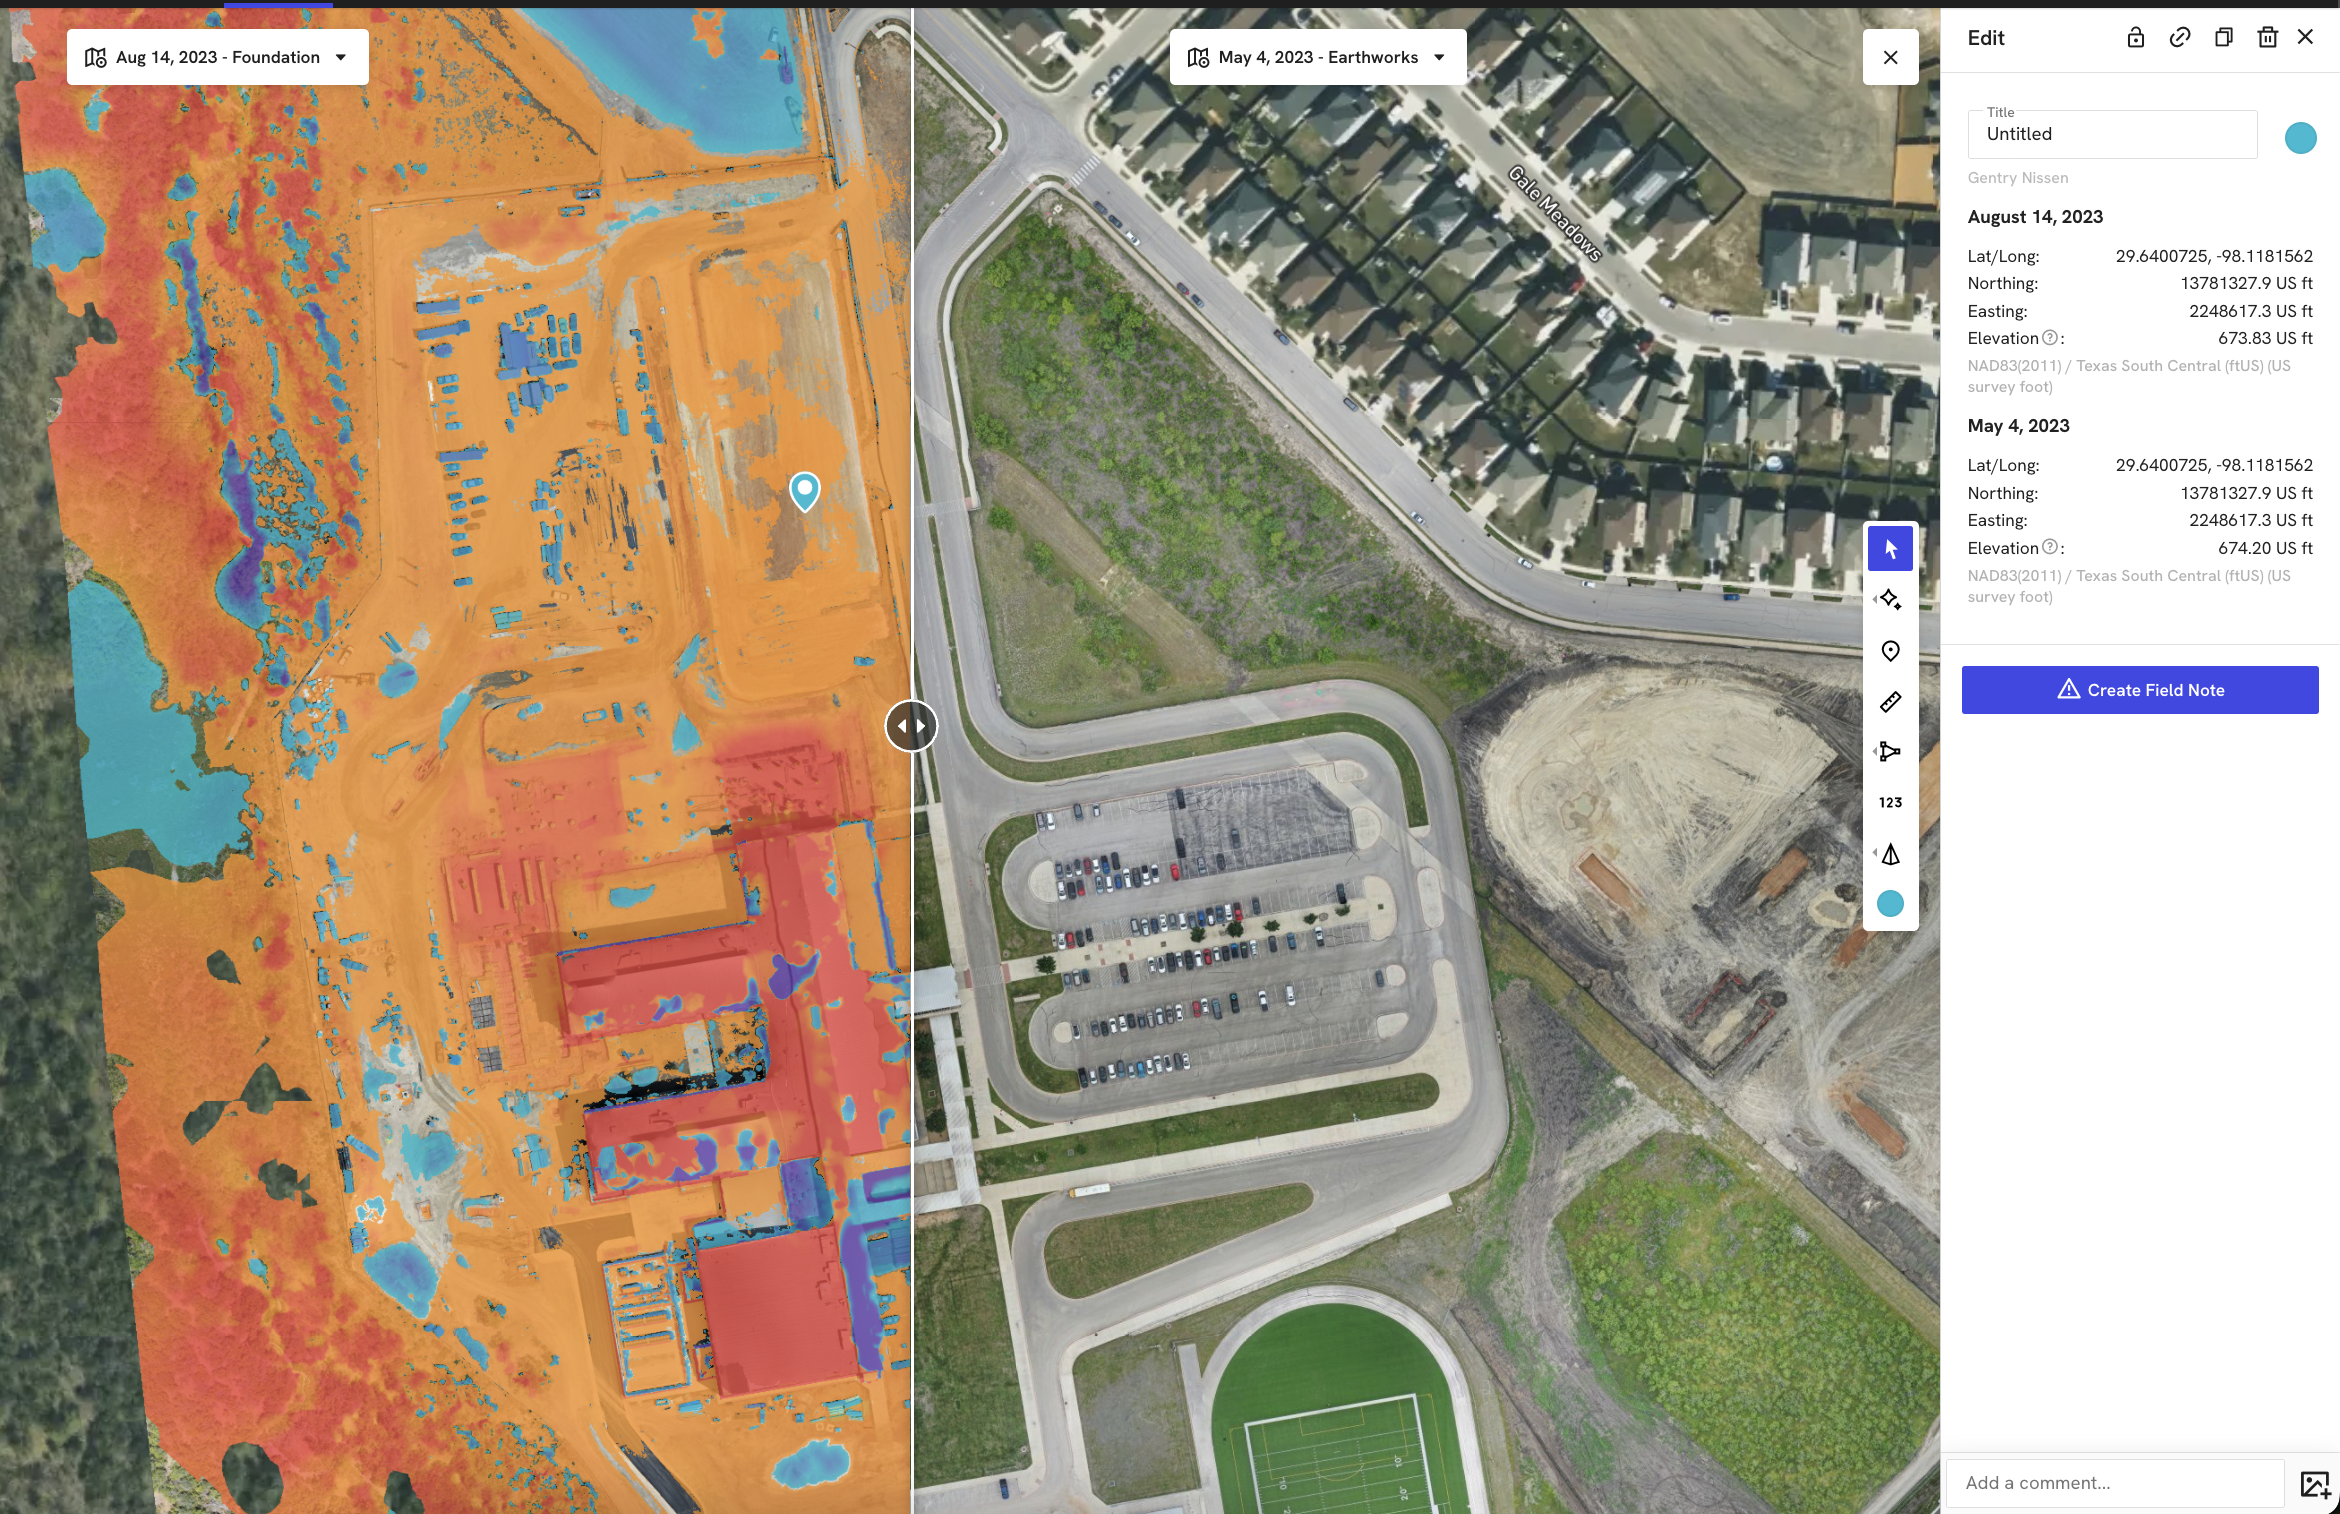
Check elevation change at a single point/coordinate using the Location Annotation:
Use the Location annotation to measure the elevation difference between two datasets at a specific geographic point. The Cut/Fill analysis layer, or the Design Surface overlay, must be toggled ON and visible.
Examples of visualizing elevation using the two available layer methods
1. Comparing a single point of elevation between maps
Limitations
GPS Variation: GPS variation between drone flights can impact visualization accuracy. If all elevations appear as "Cut," it may be due to drone GPS drift rather than soil changes.
Accuracy Requirements: For high-accuracy measurements on large sites, DroneDeploy recommends using Ground Control Points (GCPs) or RTK/PPK processing to ensure alignment between maps.
FAQs
Q: Does the Cut/Fill layer work with design files?
A: Yes. You can compare your current map to an uploaded design surface or grading plan.
Q: Why does my entire map look red?
A: This often occurs due to GPS variation between flights. Use Ground Control Points (GCPs) to ensure absolute alignment and resolve these discrepancies.
v2.2