Can I make thermal maps with DroneDeploy? Yes!
DroneDeploy is excited to support thermal mapping through our Thermal Roof Inspection app and Thermal Radiometric Processing. We also support real-time thermal mapping with Thermal Live Map.
Here is an example of a Thermal Live Map of the roof of a hospital that is under construction.
Required Hardware for Thermal Mapping
Hardware restricts availability. The Recommended & Supported Drones page provides a complete list of supported drones and sensors for flight and processing.
Common hardware for thermal processing with DroneDeploy:
| Drone/Sensor | Required Sensor Specs | Type of Thermal |
| DJI Mavic 2 Enterprise Dual* | N/A | Non-radiometric |
| DJI Mavic 2 Enterprise Advanced** | N/A | Radiometric |
| DJI Mavic 3T | N/A | Radiometric |
| DJI Matrice 4T | N/A | Dual, Thermal & Radiometric |
| Anzu Raptor T | N/A | Radiometric |
| DJI Mavic 30T** | N/A | Radiometric |
| Zenmuse H20T | N/A | Radiometric |
| Skydio X10 | N/A | Radiometric |
| Sony ILX-LR1 | N/A | Radiometric |
| FLIR Boson/Boson+ | N/A | Radiometric |
*The Mavic 2 Enterprise Dual is currently not supported for radiometric capture.
**The Mavic Enterprise Advanced and M30T hardware are not supported for waypoint flight with DroneDeploy. Processing is supported.
*** DJI is no longer manufacturing the XT2 sensor. For mapping with the M300, DJI recommends the H20T.
We're excited to release support for the M300 drone and its' relative sensors. The powerful H20T camera produces three image sets: a 12MP Wide-angle image, a 20MP zoom image, and a 640x512 IR photo at each photo location. When flying with DroneDeploy, we only capture with the IR thermal and zoom lenses. For more information on processing with DroneDeploy, see the "dual processing" section below.
Mavic 3 Enterprise Thermal (M3T)
Starting with the DroneDeploy update (v4.149.0), the M3T will be available for flight and processing. This thermal workhorse captures a 12 MP wide-angle image with an Equivalent Focal Length of 24mm, 48MP. Zoom in for closer capture with an Equivalent Focal Length of 162mm, 12MP, 56× Hybrid Zoom. Finally, capture thermal images utilizing a DFOV: 61°, Equivalent Focal Length: 40mm, Resolution 640 × 512 thermal lens.
*When operating the M3T, you can adjust the DJI app selected settings, including the choice to capture both RGB and thermal images. This requires you to enable both Infrared and Visible options before initiating the flight plan.
- Step-by-Step Guide for Conducting Thermal Roof Inspections with the DJI Mavic 3 Thermal Drone and DroneDeploy
- Calibrating the M3T Thermal Camera in the DJI Pilot App
Thermal Roof Inspection App
The Thermal Roof Inspection app is recommended to ensure you capture sufficient image overlap for thermal inspection projects. Download it from our app market here.
It is designed for drones with the most famous thermal cameras: the DJI M200/210 & Flir XT/XT2 or Inspire 1 & Flir XT. Please take a look at the sensor specifications above.
The app ensures high-overlap images on the rooftop, providing the best quality results when the map is processed.
Limitations of the App:
- DroneDeploy saves the adjustments made to the flight according to the values provided in the Thermal Roof Inspection app. However, upon refreshing or returning to the page, we do not display the saved values (we display the app defaults).
Enhanced Thermal Flight

Click on the Camera Toggle to switch between RGB and Thermal View.
Enhanced Thermal Flight Control allows the pilot more flexibility while conducting inspections with dual RGB and thermal cameras. Start your Mission using your preferred capture method, then easily toggle between RGB and thermal while flying to inspect assets or highlight issues one camera might not see easily. This feature can be used during live mapping or manual flight.
Enhanced Thermal Flight can be used only on dual-camera drones, XT2 and Mavic Dual, and is available on Advanced, Teams, and Enterprise tiers.
Thermal Live Map
Thermal Live Map is a quick way to capture a thermal map and take action in real-time. During the live map, camera capture can continue as usual, so later uploading is still possible to upgrade the map quality.
Thermal Live Map is only available for iOS devices manufactured in late 2016 or later (iPhone 7 or iPad Air 2 or newer). The newer the device, the better your experience will be.
Getting the best results with Thermal Live Map
The default flight settings will work well for Thermal Live Map, and all the normal live map best practices apply. We recommend not flying below 150ft (45m) above the object of interest.
When mapping solar panels, ensure your flight plan has legs parallel to the panels' rows. Avoid flying during mid-day and times when sunlight is reflected off panels directly toward your camera.
When mapping commercial roofs, your flight plan must be slightly inset from the roof perimeter (see example below). Doing this will significantly reduce mapping artifacts.
For additional tips on drone inspections for commercial roofs, check out this video by FLIR: https://www.flir.com/suas/delta/delta-episode-9/
We also recommend avoiding areas that vary more than 75ft (25m) in elevation. Areas with small hills and buildings should be delicate, but buildings or terrain taller than five stories (50ft or 15m) may cause stitching problems in the Thermal Live Map.
We see a greater success rate for thermal maps processed in Structures Mode.
Tips for improving the quality of your thermal images
You should turn on your drone and plug in your XT/XT2 camera to warm up for 3-5 minutes. You should also avoid flying in weather with:
- Wind speeds over 12 mph
- Humidity over 50%
- Any precipitation
Thermal Radiometric Processing
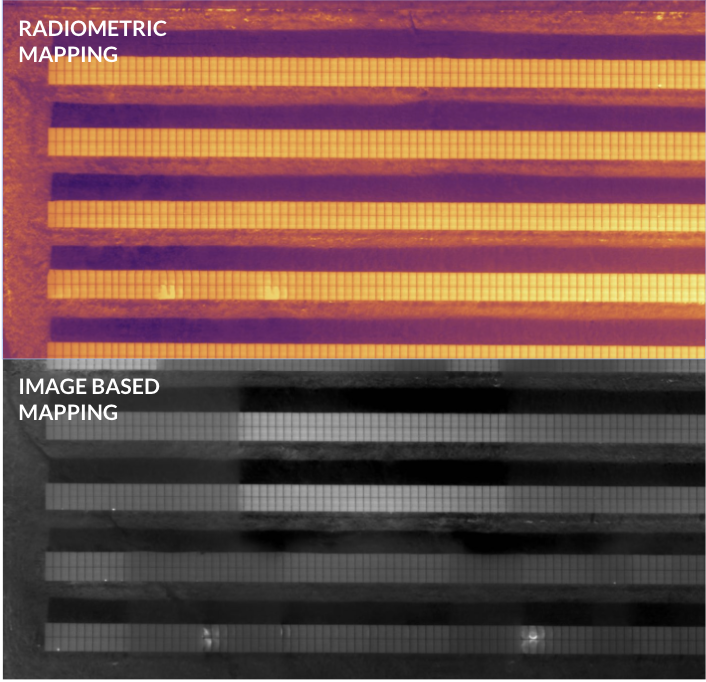
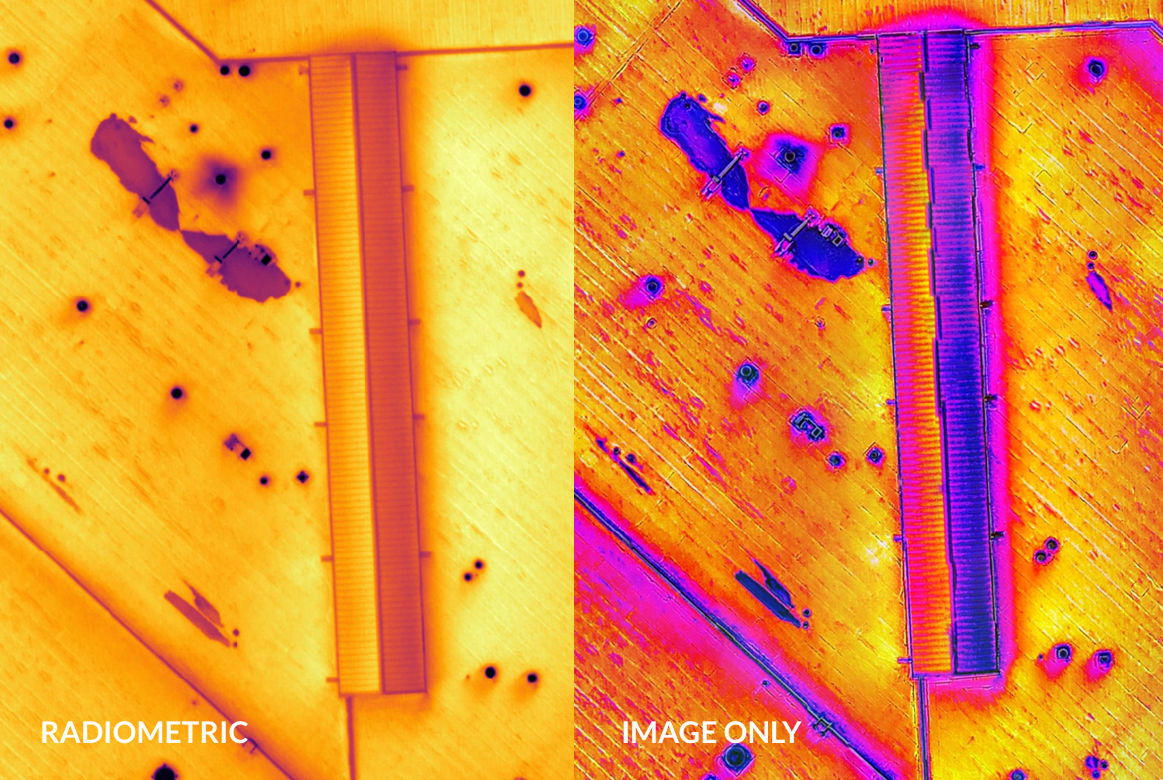
Enterprise customers capturing radiometric thermal images can request access to our Radiometric Thermal Processing. This will provide significantly improved reconstruction results for complex thermal datasets.
We use the absolute temperature data embedded into the images from high-quality Thermal cameras to provide consistent thermal coloring across the map area.
Insurance customers find water ingress, roof degradation, weather damage, and low-quality installation.
Oil & Gas customers are revealing underground pipelines, leaks, and hotspots.
Solar customers are detecting string outages, faulty modules, and even sub-module defects over hundreds of MW.
'Dual-Mode' Standard and Radiometric Processing
As stated above, DroneDeploy Enterprise customers can upload both thermal and RGB imagery as a single dataset to produce higher-quality finished thermal maps and models in addition to standard radiometric thermal processing.
Thermal sensors like the DJI Zenmuse XT2 can capture simultaneous thermal and RGB imagery during flight.
For example, a user flies a single roof inspection flight using the DJI Zenmuse XT2 camera and produces 300 RGB images saved to one SD card and 300 thermal images to the second SD card, a total of 600 images. That user can then upload all 600 images to a single "Map & Model" in the "Upload" tab.
DroneDeploy will use the RGB imagery as a high-resolution context during photogrammetry and texture the final map and model with the temperature data to yield a high-quality finished thermal map and model.
*Note that if an RGB map is also a desired output—for example, to make a side-by-side comparison against the thermal map, as seen in the section Analyzing Radiometric Thermal Maps below—you can upload just the RGB images as you would for a standard map.
Ground Control Points (GCPs) are not currently supported for thermal or radiometric thermal processing in DroneDeploy. If you require survey‑grade accuracy, we recommend capturing a matching RGB dataset and processing it with GCPs as a standard Map & Model. Use the RGB map for precise measurements and alignment, and use the thermal layer to identify relative hot and cold areas.

Radiometric Solar Field

Radiometric Roof Inspection
Analyzing Thermal Maps
Annotations, measurements, and field notes work great with Thermal Maps. Annotations can mark problem areas, such as the locations of offline or deficient solar panels. Measuring tools can approximate the scale of water damage on a roof when estimating repair costs.
Could you annotate problem areas like the bubbling on this roof?
Analyzing Radiometric Thermal Maps
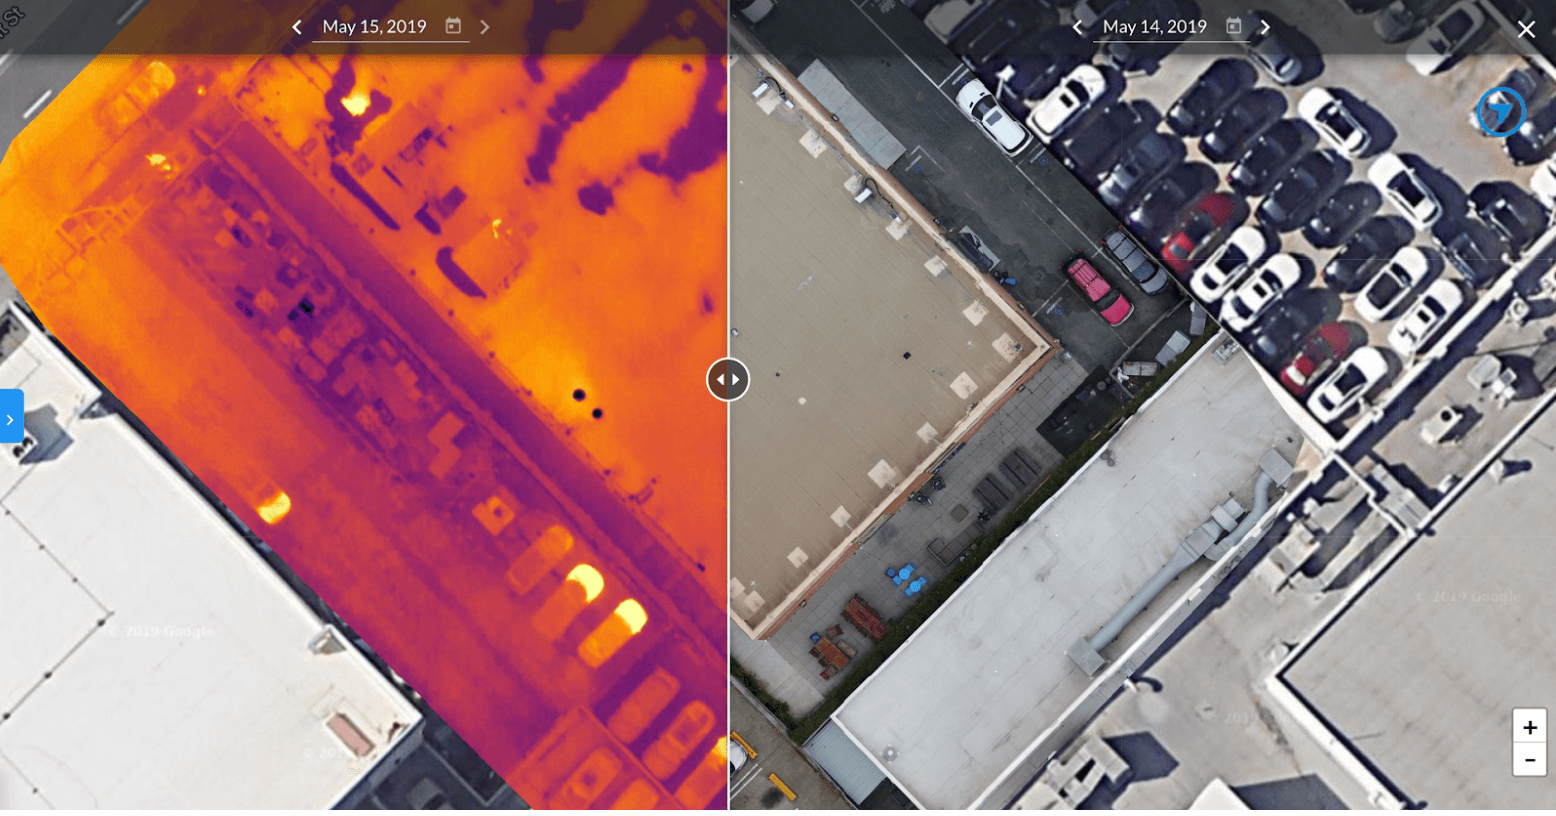
Non-radiometric thermal data is excellent for identifying relative hot and cold spots, which could indicate problems you need to address. Still, it does not allow you to compare actual temperatures. You may also use the side-by-side comparison tool to compare a thermal map of your location to a regular photo map to help you better understand what might be causing a hot or cold spot. Select your thermal map, enter side-by-side mode, and select a comparison map that does not have a thermal layer present.

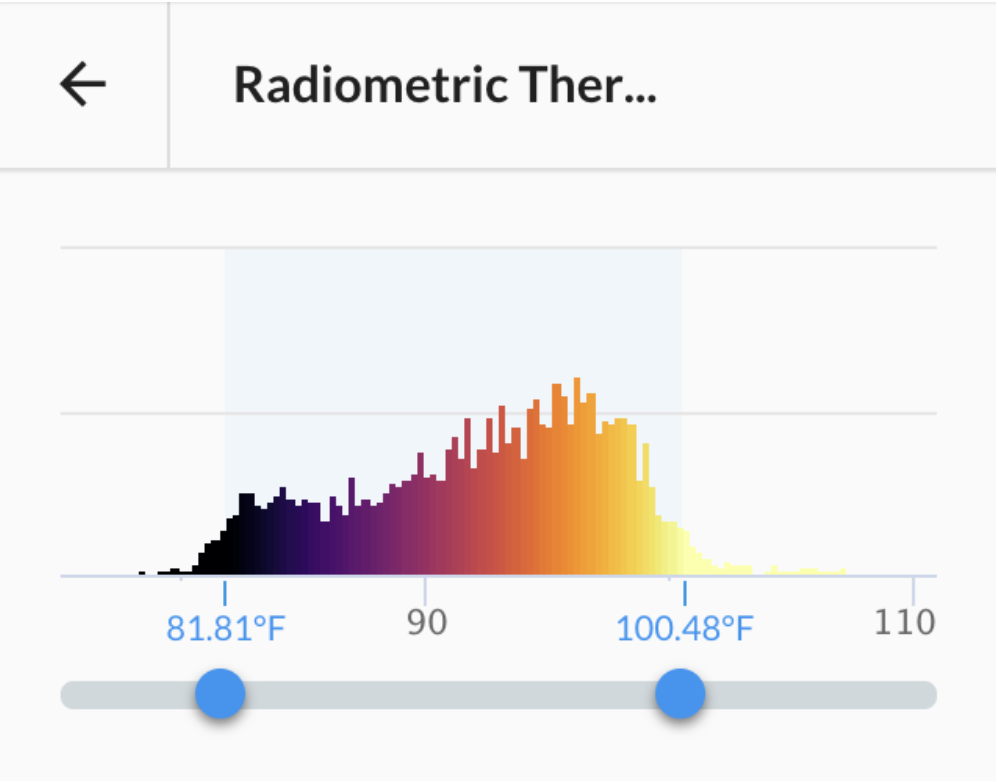
For radiometric thermal maps, you can inspect the temperature at a specific point or adjust your visualization to identify areas of your map that may be outside of acceptable temperature ranges.

Please remember that your temperature measurements can be as accurate as the sensor used to capture the data.
Note: Range settings currently only apply to 2D viewing. Your 3D thermal map will show the full range as captured by the images metadata.
Resolution on Thermal Maps
A Thermal Live Map's resolution (ground sampling distance) depends on your flight altitude and is generally 1/5 of the resolution of an equivalent RGB DroneDeploy map. This is due to the limited resolution of thermal sensors. Here are some resolution examples for different Thermal Mapping altitudes.
| Altitude | Ground Sampling Distance |
|---|---|
| 150ft | 2.5 in/pixel (6 cm/pixel) |
| 250ft | 4 in/pixel (10.5 cm/pixel) |
| 350ft | 6 in/pixel (15 cm/pixel) |
| 400ft | 6.5 in/pixel (17 cm/pixel) |